Guoshu Yang, Shiqiang Xiong, Yan Luo, Duan Luo, Michael Shehata, Zhen Zhang, Lin Cai, Xunzhang Wang, Ashkan Ehdaie, Hanxiong Liu
{"title":"The relative voltage index: a novel tailored method to identify left atrial low voltage areas in non-paroxysmal AF.","authors":"Guoshu Yang, Shiqiang Xiong, Yan Luo, Duan Luo, Michael Shehata, Zhen Zhang, Lin Cai, Xunzhang Wang, Ashkan Ehdaie, Hanxiong Liu","doi":"10.3389/fcvm.2025.1656983","DOIUrl":null,"url":null,"abstract":"<p><strong>Background: </strong>The optimal voltage threshold for determining low voltage areas (LVA) in non-paroxysmal atrial fibrillation (<i>N</i>PAF) is unclear. This study aims to evaluate a patient-specific voltage measurement using the left atrial appendage (LAA) as a benchmark to establish a normalized threshold for detecting LVA in NPAF.</p><p><strong>Methods: </strong>Bipolar LA and LAA voltage in 40 NPAF and 42 patients with no AF (control group) were studied in sinus rhythm (SR) and AF (NPAF group) and SR only in the control group. Bipolar LA and LAA voltage distribution were compared between the NPAF and control groups. Fibrotic regions identified by late gadolinium-enhanced magnetic resonance imaging (LGE-MRI) was used as the reference standard comparison in the NPAF group.</p><p><strong>Results: </strong>The median, 5th percentile (V<sub>LA5%</sub>), and the 95th percentile of bipolar voltage in the LA were significantly lower in NPAF patients than controls. No significant LAA voltage differences between groups [median = 3.303 (1.796) vs. 3.100 (1.045); V<sub>LAA95%</sub> = 8.089 (3.571) vs. 7.604 (3.404), all <i>p</i> > 0.05]. A strong linear correlation between V<sub>LA5%</sub> and V<sub>LAA95%</sub> was observed in the control group. The standardized relative voltage index (RVI) factor of 0.1324 was identified as the threshold for defining LVA and calculated as V<sub>LA5%</sub> = 0.1324 × V<sub>LAA95%</sub>. The correlation between LVA guided by RVI was superior to the universal threshold for detecting LVA in sinus and AF rhythms using LGE-MRI as the gold standard.</p><p><strong>Conclusion: </strong>A patient-tailored low voltage threshold can be obtained using a simplified equation and provides more accurate representation of LVA in NPAF than universal thresholds.</p>","PeriodicalId":12414,"journal":{"name":"Frontiers in Cardiovascular Medicine","volume":"12 ","pages":"1656983"},"PeriodicalIF":2.8000,"publicationDate":"2025-09-16","publicationTypes":"Journal Article","fieldsOfStudy":null,"isOpenAccess":false,"openAccessPdf":"https://www.ncbi.nlm.nih.gov/pmc/articles/PMC12479551/pdf/","citationCount":"0","resultStr":null,"platform":"Semanticscholar","paperid":null,"PeriodicalName":"Frontiers in Cardiovascular Medicine","FirstCategoryId":"3","ListUrlMain":"https://doi.org/10.3389/fcvm.2025.1656983","RegionNum":3,"RegionCategory":"医学","ArticlePicture":[],"TitleCN":null,"AbstractTextCN":null,"PMCID":null,"EPubDate":"2025/1/1 0:00:00","PubModel":"eCollection","JCR":"Q2","JCRName":"CARDIAC & CARDIOVASCULAR SYSTEMS","Score":null,"Total":0}
引用次数: 0
Abstract
Background: The optimal voltage threshold for determining low voltage areas (LVA) in non-paroxysmal atrial fibrillation (NPAF) is unclear. This study aims to evaluate a patient-specific voltage measurement using the left atrial appendage (LAA) as a benchmark to establish a normalized threshold for detecting LVA in NPAF.
Methods: Bipolar LA and LAA voltage in 40 NPAF and 42 patients with no AF (control group) were studied in sinus rhythm (SR) and AF (NPAF group) and SR only in the control group. Bipolar LA and LAA voltage distribution were compared between the NPAF and control groups. Fibrotic regions identified by late gadolinium-enhanced magnetic resonance imaging (LGE-MRI) was used as the reference standard comparison in the NPAF group.
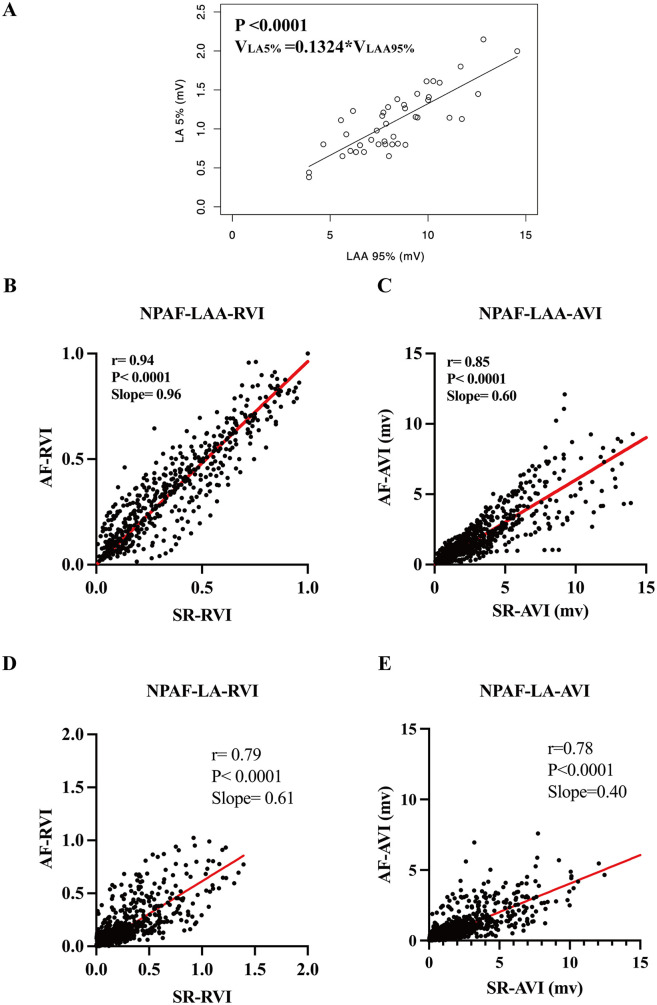
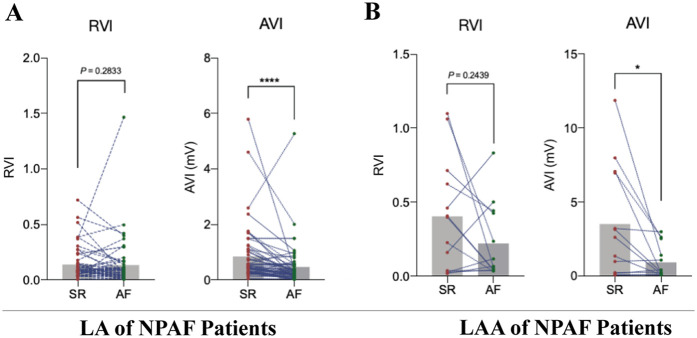
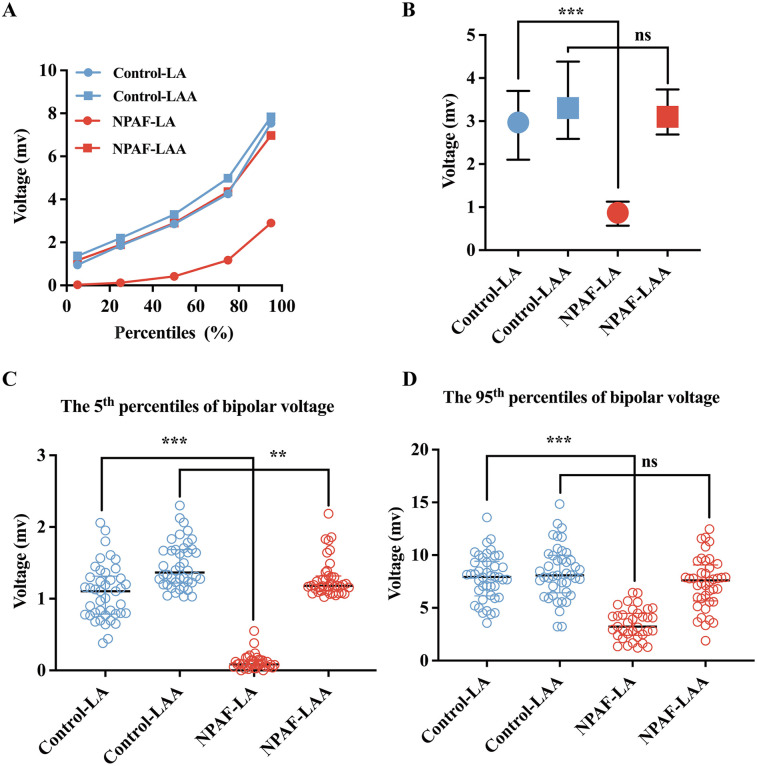
Results: The median, 5th percentile (VLA5%), and the 95th percentile of bipolar voltage in the LA were significantly lower in NPAF patients than controls. No significant LAA voltage differences between groups [median = 3.303 (1.796) vs. 3.100 (1.045); VLAA95% = 8.089 (3.571) vs. 7.604 (3.404), all p > 0.05]. A strong linear correlation between VLA5% and VLAA95% was observed in the control group. The standardized relative voltage index (RVI) factor of 0.1324 was identified as the threshold for defining LVA and calculated as VLA5% = 0.1324 × VLAA95%. The correlation between LVA guided by RVI was superior to the universal threshold for detecting LVA in sinus and AF rhythms using LGE-MRI as the gold standard.
Conclusion: A patient-tailored low voltage threshold can be obtained using a simplified equation and provides more accurate representation of LVA in NPAF than universal thresholds.
期刊介绍:
Frontiers? Which frontiers? Where exactly are the frontiers of cardiovascular medicine? And who should be defining these frontiers?
At Frontiers in Cardiovascular Medicine we believe it is worth being curious to foresee and explore beyond the current frontiers. In other words, we would like, through the articles published by our community journal Frontiers in Cardiovascular Medicine, to anticipate the future of cardiovascular medicine, and thus better prevent cardiovascular disorders and improve therapeutic options and outcomes of our patients.
 求助内容:
求助内容: 应助结果提醒方式:


