{"title":"Power-Law Reliability Plotting for Microelectronics.","authors":"Joseph B Bernstein","doi":"10.3390/mi16091055","DOIUrl":null,"url":null,"abstract":"<p><p>The power-law time plotting for reliability prediction needs to be reexamined. Until now, most degradation plots in microelectronics reliability analysis assume that the data follow a power-law change in time. The plot is the change in a measured parameter versus the log of time, based on the principle that one can calculate exactly the initial indicator value, S<sub>0</sub>, and from that, extrapolate any change in that parameter, ΔS(t), as a power-law with time, t<sup>1/m</sup>. The normalized change, ΔS(t)/S<sub>0</sub>, relies heavily on a precise value for S<sub>0</sub> such that the calculated power-law exponent, m, may be exaggerated such that extrapolated time-to-fail calculations will be optimistic, even by many orders of magnitude. Also, the extrapolated lifetime may be pessimistic, also by orders of magnitude in time. We show that by transforming the <i>x</i>-axis as the time to a power of 1/m, choosing m by setting the second order of a polynomial curve fit to zero, a more accurate prediction can be achieved with a realistic time to fail given the accelerated testing conditions. We also show how to determine what the correct power of time is using a linear fit to a second-order polynomial. The plotting principles presented here are independent of any physics, rather an empirical focus on how to plot the data according to a power-law in time assumption.</p>","PeriodicalId":18508,"journal":{"name":"Micromachines","volume":"16 9","pages":""},"PeriodicalIF":3.0000,"publicationDate":"2025-09-16","publicationTypes":"Journal Article","fieldsOfStudy":null,"isOpenAccess":false,"openAccessPdf":"https://www.ncbi.nlm.nih.gov/pmc/articles/PMC12471611/pdf/","citationCount":"0","resultStr":null,"platform":"Semanticscholar","paperid":null,"PeriodicalName":"Micromachines","FirstCategoryId":"5","ListUrlMain":"https://doi.org/10.3390/mi16091055","RegionNum":3,"RegionCategory":"工程技术","ArticlePicture":[],"TitleCN":null,"AbstractTextCN":null,"PMCID":null,"EPubDate":"","PubModel":"","JCR":"Q2","JCRName":"CHEMISTRY, ANALYTICAL","Score":null,"Total":0}
引用次数: 0
Abstract
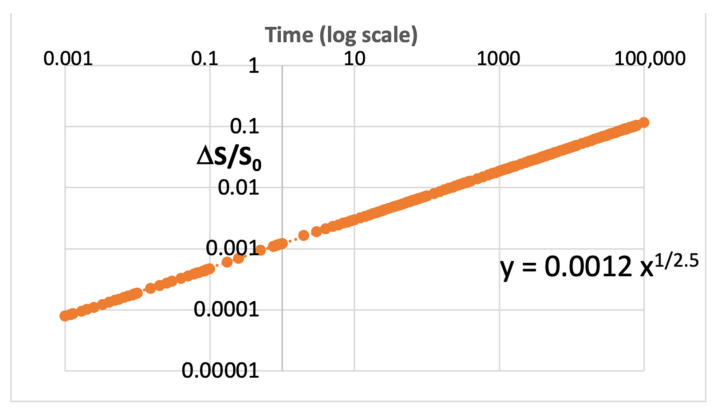
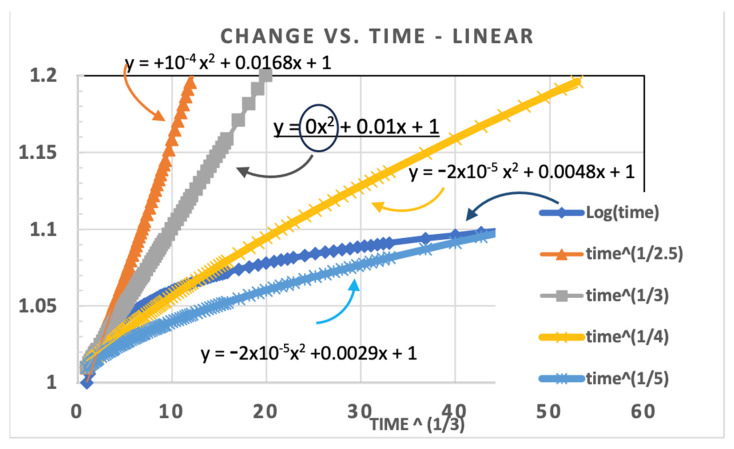
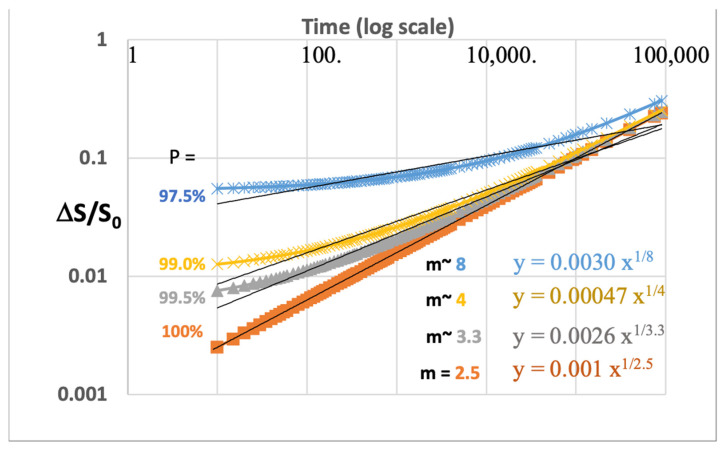
The power-law time plotting for reliability prediction needs to be reexamined. Until now, most degradation plots in microelectronics reliability analysis assume that the data follow a power-law change in time. The plot is the change in a measured parameter versus the log of time, based on the principle that one can calculate exactly the initial indicator value, S0, and from that, extrapolate any change in that parameter, ΔS(t), as a power-law with time, t1/m. The normalized change, ΔS(t)/S0, relies heavily on a precise value for S0 such that the calculated power-law exponent, m, may be exaggerated such that extrapolated time-to-fail calculations will be optimistic, even by many orders of magnitude. Also, the extrapolated lifetime may be pessimistic, also by orders of magnitude in time. We show that by transforming the x-axis as the time to a power of 1/m, choosing m by setting the second order of a polynomial curve fit to zero, a more accurate prediction can be achieved with a realistic time to fail given the accelerated testing conditions. We also show how to determine what the correct power of time is using a linear fit to a second-order polynomial. The plotting principles presented here are independent of any physics, rather an empirical focus on how to plot the data according to a power-law in time assumption.
期刊介绍:
Micromachines (ISSN 2072-666X) is an international, peer-reviewed open access journal which provides an advanced forum for studies related to micro-scaled machines and micromachinery. It publishes reviews, regular research papers and short communications. Our aim is to encourage scientists to publish their experimental and theoretical results in as much detail as possible. There is no restriction on the length of the papers. The full experimental details must be provided so that the results can be reproduced.

 求助内容:
求助内容: 应助结果提醒方式:


