Raul Freire, Kinta D Schott, Brooke Butterick, Zack Stow, Parker Kooima, Sai Tejaswari Gopalakrishnan, Emily Dow, Jason C Siegler, Jefferey L Burgess, Floris C Wardenaar
{"title":"A 3D color model reports urine color similarly to a printed color chart with similar accuracy to determine a low vs. high urine concentration.","authors":"Raul Freire, Kinta D Schott, Brooke Butterick, Zack Stow, Parker Kooima, Sai Tejaswari Gopalakrishnan, Emily Dow, Jason C Siegler, Jefferey L Burgess, Floris C Wardenaar","doi":"10.1186/s44410-025-00009-3","DOIUrl":null,"url":null,"abstract":"<p><strong>Background: </strong>Urine color (Uc) assessment is impacted by container, volume, and light conditions, potentially influencing Uc scoring. This study aimed to evaluate a 3D Uc model vs. Printed Uc chart's accuracy for identifying a low vs. high urine concentration in the morning and afternoon.</p><p><strong>Results: </strong>Participants (<i>n</i> = 73, 12% female, age: ~ 27 years) collected all urine voids for two consecutive days (32 h total), resulting in two partially concurrent 24-h urine collections that were compared with a morning and afternoon assessment. Median and [interquartile range] Uc differed between the Printed chart and 3D Uc model in the morning (2.0 [1.5-3.0] vs. 2.0 [2.0-4.0], <i>p</i> < 0.001), but not in the afternoon (2.0 [1.0 - 3.0] vs. 2.0 [1.0 - 3.0], <i>p</i> = 0.07). The models had a moderate correlation in the morning (<i>r</i> = 0.66, <i>p</i> < 0.001) and a strong correlation in the afternoon (<i>r</i> = 0.83, <i>p</i> < 0.001). Bland-Altman plots revealed a slight bias (-0.60 and -0.27 for morning and afternoon, respectively), with significant reporting bias only for the morning, <i>p</i> = 0.04. The Area Under the Curve (AUC), to correctly classify urine concentration, was poor for morning Printed (0.62) and 3D (0.59) vs. fair for afternoon Printed (0.78) and 3D (0.74) for USG 24 h. Interestingly, the AUC for spot urine sample color was high (i.e., morning: 0.84 and 0.79), and afternoon: 0.91 and 0.92) for the Printed chart and 3D Uc model, respectively.</p><p><strong>Conclusions: </strong>The printed chart and 3D Uc model presented similar scores but with slightly higher accuracy in the afternoon.</p><p><strong>Supplementary information: </strong>The online version contains supplementary material available at 10.1186/s44410-025-00009-3.</p>","PeriodicalId":521058,"journal":{"name":"Performance nutrition","volume":"1 1","pages":"8"},"PeriodicalIF":0.0000,"publicationDate":"2025-01-01","publicationTypes":"Journal Article","fieldsOfStudy":null,"isOpenAccess":false,"openAccessPdf":"https://www.ncbi.nlm.nih.gov/pmc/articles/PMC12447702/pdf/","citationCount":"0","resultStr":null,"platform":"Semanticscholar","paperid":null,"PeriodicalName":"Performance nutrition","FirstCategoryId":"1085","ListUrlMain":"https://doi.org/10.1186/s44410-025-00009-3","RegionNum":0,"RegionCategory":null,"ArticlePicture":[],"TitleCN":null,"AbstractTextCN":null,"PMCID":null,"EPubDate":"2025/9/12 0:00:00","PubModel":"Epub","JCR":"","JCRName":"","Score":null,"Total":0}
引用次数: 0
Abstract
Background: Urine color (Uc) assessment is impacted by container, volume, and light conditions, potentially influencing Uc scoring. This study aimed to evaluate a 3D Uc model vs. Printed Uc chart's accuracy for identifying a low vs. high urine concentration in the morning and afternoon.
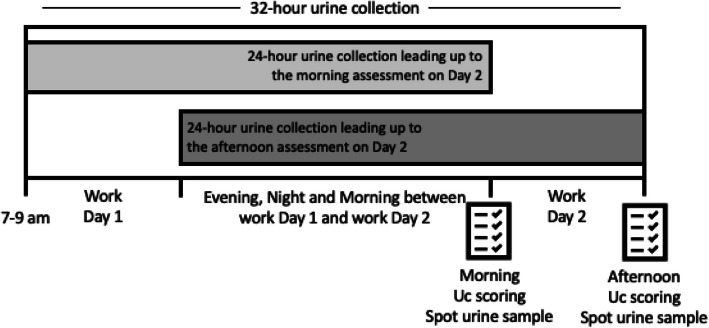
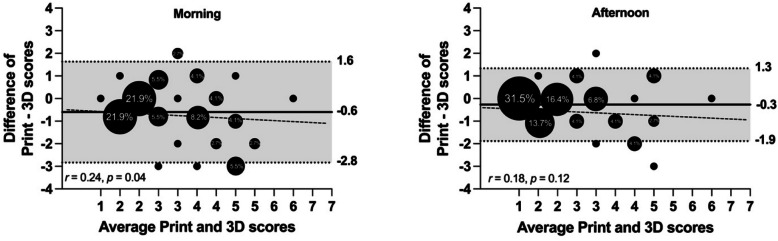
Results: Participants (n = 73, 12% female, age: ~ 27 years) collected all urine voids for two consecutive days (32 h total), resulting in two partially concurrent 24-h urine collections that were compared with a morning and afternoon assessment. Median and [interquartile range] Uc differed between the Printed chart and 3D Uc model in the morning (2.0 [1.5-3.0] vs. 2.0 [2.0-4.0], p < 0.001), but not in the afternoon (2.0 [1.0 - 3.0] vs. 2.0 [1.0 - 3.0], p = 0.07). The models had a moderate correlation in the morning (r = 0.66, p < 0.001) and a strong correlation in the afternoon (r = 0.83, p < 0.001). Bland-Altman plots revealed a slight bias (-0.60 and -0.27 for morning and afternoon, respectively), with significant reporting bias only for the morning, p = 0.04. The Area Under the Curve (AUC), to correctly classify urine concentration, was poor for morning Printed (0.62) and 3D (0.59) vs. fair for afternoon Printed (0.78) and 3D (0.74) for USG 24 h. Interestingly, the AUC for spot urine sample color was high (i.e., morning: 0.84 and 0.79), and afternoon: 0.91 and 0.92) for the Printed chart and 3D Uc model, respectively.
Conclusions: The printed chart and 3D Uc model presented similar scores but with slightly higher accuracy in the afternoon.
Supplementary information: The online version contains supplementary material available at 10.1186/s44410-025-00009-3.
背景:尿液颜色(Uc)评估受容器、体积和光照条件的影响,可能影响Uc评分。本研究旨在评估3D Uc模型与打印Uc图表在识别上午和下午尿浓度高低方面的准确性。结果:参与者(n = 73, 12%女性,年龄~ 27岁)连续两天(共32小时)收集所有尿空,导致两次部分并发的24小时尿液收集,与上午和下午的评估进行比较。上午打印图表和3D Uc模型的中位数和[四分位数范围]Uc差异(2.0 [1.5-3.0]vs. 2.0 [2.0-4.0], p p = 0.07)。这些模型在早晨有中等相关性(r = 0.66, p r = 0.83, p p = 0.04)。曲线下面积(AUC),正确分类尿液浓度,上午打印(0.62)和3D(0.59)较差,而下午打印(0.78)和3D (0.74) USG 24小时比较好。有趣的是,现场尿样颜色的AUC高(即上午:0.84和0.79),下午:0.91和0.92)分别打印图表和3D Uc模型。结论:打印图表与3D Uc模型得分相近,但下午的准确率略高。补充信息:在线版本包含补充资料,提供地址为10.1186/s44410-025-00009-3。

 求助内容:
求助内容: 应助结果提醒方式:


