Matthew J Saunders, J Peter Cegielski, Rebecca A Clark, Rein M G J Houben, C Finn McQuaid
{"title":"Body mass index and tuberculosis risk: an updated systematic literature review and dose-response meta-analysis.","authors":"Matthew J Saunders, J Peter Cegielski, Rebecca A Clark, Rein M G J Houben, C Finn McQuaid","doi":"10.1093/ije/dyaf154","DOIUrl":null,"url":null,"abstract":"<p><strong>Background: </strong>The relationship between nutritional status and tuberculosis is critically important but poorly understood. We extended a 2009 review characterizing the relationship between body mass index (BMI) and tuberculosis risk.</p><p><strong>Methods: </strong>We systematically searched for new studies published between 2009 and 2024 investigating BMI and tuberculosis risk in adults. We extracted estimates of risk in BMI categories, used resampling to assign a median BMI 'dose' within each category, and included these in one-stage dose-response meta-analyses, stratifying results by population group and country tuberculosis burden. We fitted linear models for comparability with the 2009 review and restricted cubic spline models to investigate nonlinear relationships and piecewise linear models.</p><p><strong>Results: </strong>Our analyses showed an inverse dose-response relationship between BMI and tuberculosis risk across all populations in the full underweight to obese range (15.0-35.0 kg/m2). The spline and piecewise linear models showed a nonlinear relationship-in 22 general-population cohorts (n = 24 921 531), there was a steep per-unit reduction in risk for BMI of <25.0 kg/m2 [18.0%, 95% confidence interval (CI): 16.4-19.6], which decreased more gradually for BMI of ≥25.0 kg/m2 (6.9%, 95% CI: 4.6-9.2). In 18 cohorts of people with HIV (n = 162 609), the reduction was 15.3% for BMI of <23.0 kg/m2 (95% CI: 13.1-17.5) and 2.6% (95% CI: -3.1-7.9) for BMI of ≥23.0 kg/m2. In three cohorts of people with diabetes (n = 1 118 424), the reduction was 20.5% for BMI of <24.0 kg/m2 (95% CI: 18.4-22.6) and 13.4% (95% CI: 3.9-22.0) for BMI of ≥24.0 kg/m2. Based on the global BMI distribution, we estimated a relative risk of tuberculosis associated with undernutrition (BMI < 18.5 kg/m2) of 5.0 (95% CI: 4.2-5.9).</p><p><strong>Conclusion: </strong>Our results highlight the independent importance of nutritional status as a driver of the tuberculosis epidemic.</p>","PeriodicalId":14147,"journal":{"name":"International journal of epidemiology","volume":"54 5","pages":""},"PeriodicalIF":5.9000,"publicationDate":"2025-08-18","publicationTypes":"Journal Article","fieldsOfStudy":null,"isOpenAccess":false,"openAccessPdf":"https://www.ncbi.nlm.nih.gov/pmc/articles/PMC12417079/pdf/","citationCount":"0","resultStr":null,"platform":"Semanticscholar","paperid":null,"PeriodicalName":"International journal of epidemiology","FirstCategoryId":"3","ListUrlMain":"https://doi.org/10.1093/ije/dyaf154","RegionNum":2,"RegionCategory":"医学","ArticlePicture":[],"TitleCN":null,"AbstractTextCN":null,"PMCID":null,"EPubDate":"","PubModel":"","JCR":"Q1","JCRName":"PUBLIC, ENVIRONMENTAL & OCCUPATIONAL HEALTH","Score":null,"Total":0}
引用次数: 0
Abstract
Background: The relationship between nutritional status and tuberculosis is critically important but poorly understood. We extended a 2009 review characterizing the relationship between body mass index (BMI) and tuberculosis risk.
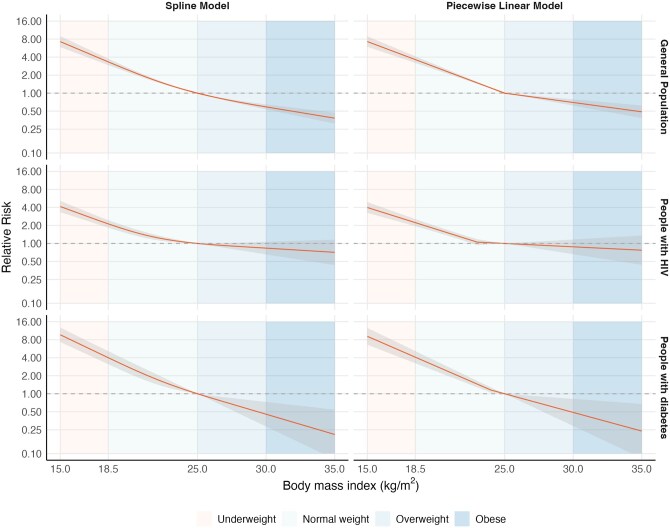
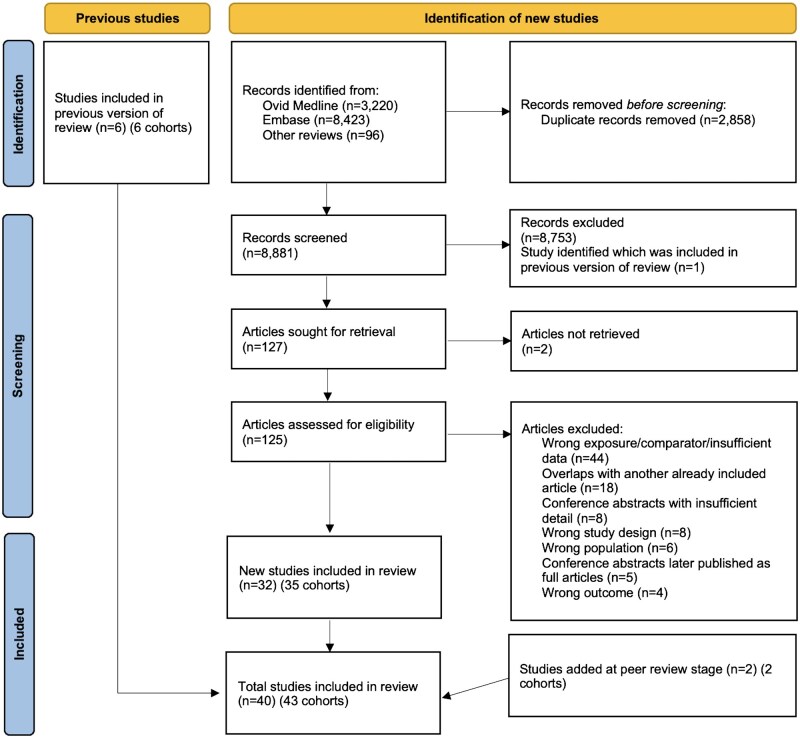
Methods: We systematically searched for new studies published between 2009 and 2024 investigating BMI and tuberculosis risk in adults. We extracted estimates of risk in BMI categories, used resampling to assign a median BMI 'dose' within each category, and included these in one-stage dose-response meta-analyses, stratifying results by population group and country tuberculosis burden. We fitted linear models for comparability with the 2009 review and restricted cubic spline models to investigate nonlinear relationships and piecewise linear models.
Results: Our analyses showed an inverse dose-response relationship between BMI and tuberculosis risk across all populations in the full underweight to obese range (15.0-35.0 kg/m2). The spline and piecewise linear models showed a nonlinear relationship-in 22 general-population cohorts (n = 24 921 531), there was a steep per-unit reduction in risk for BMI of <25.0 kg/m2 [18.0%, 95% confidence interval (CI): 16.4-19.6], which decreased more gradually for BMI of ≥25.0 kg/m2 (6.9%, 95% CI: 4.6-9.2). In 18 cohorts of people with HIV (n = 162 609), the reduction was 15.3% for BMI of <23.0 kg/m2 (95% CI: 13.1-17.5) and 2.6% (95% CI: -3.1-7.9) for BMI of ≥23.0 kg/m2. In three cohorts of people with diabetes (n = 1 118 424), the reduction was 20.5% for BMI of <24.0 kg/m2 (95% CI: 18.4-22.6) and 13.4% (95% CI: 3.9-22.0) for BMI of ≥24.0 kg/m2. Based on the global BMI distribution, we estimated a relative risk of tuberculosis associated with undernutrition (BMI < 18.5 kg/m2) of 5.0 (95% CI: 4.2-5.9).
Conclusion: Our results highlight the independent importance of nutritional status as a driver of the tuberculosis epidemic.
期刊介绍:
The International Journal of Epidemiology is a vital resource for individuals seeking to stay updated on the latest advancements and emerging trends in the field of epidemiology worldwide.
The journal fosters communication among researchers, educators, and practitioners involved in the study, teaching, and application of epidemiology pertaining to both communicable and non-communicable diseases. It also includes research on health services and medical care.
Furthermore, the journal presents new methodologies in epidemiology and statistics, catering to professionals working in social and preventive medicine. Published six times a year, the International Journal of Epidemiology provides a comprehensive platform for the analysis of data.
Overall, this journal is an indispensable tool for staying informed and connected within the dynamic realm of epidemiology.
 求助内容:
求助内容: 应助结果提醒方式:


