Implementing tile-based fisher ratio analysis of two-dimensional gas chromatography time-of-flight mass spectrometry data to obtain a master peak table of all detected analyte compounds in many petroleum-based samples
IF 3.2
引用次数: 0
Abstract
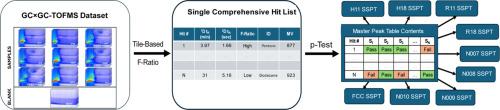
Historically, tile-based Fisher ratio (F-ratio) analysis of comprehensive two-dimensional gas chromatography time-of-flight mass spectrometry (GC × GC-TOFMS) data was developed for analysts to use a supervised experimental design with defined sample classes to obtain a hit list to discover analytes that most significantly distinguish the sample classes at the top of the hit list. In this traditional application, a user-specified F-ratio threshold is used to discard most hits in order to focus on the top hits. To broaden the scope of tile-based F-ratio analysis, in the present study we explore the ability of the software to discover all analyte components that are detected in a set of samples, essentially taking full advantage of the tiling aspect of the software which uncovers all analytes that exhibit sufficient signal relative to the baseline noise across all samples to be deemed detectable and hence to produce an F-ratio. For this study a set of nine petroleum samples, i.e., two hydrobates (light naphthas), two reformates, four naphthas, and a “heavy” gasoline, are simultaneously analyzed and statistically compared via p-testing to blank chromatograms to produce one comprehensive hit list. The pin locations and signal areas at the top m/z F-ratio are used together with replicate blanks to generate a master peak table (MPT) that in turn is used to generate sample-specific peak tables (SSPT), one SSPT for each injection replicate of each petroleum sample (class), that are naturally retention-time aligned via the F-ratio software. The nine petroleum samples vary to a large extent in the identity and number of analytes present. Indeed, while a total of ∼715 analytes were found across all nine samples, only ∼260 of these analytes are fully shared across all sample classes. The number of analytes in the nine petroleum samples ranged from an average of 335 analytes for one of the hydrobates to 669 analytes for two of the naphthas. This workflow also facilitated generating simulated distillation curves for the nine petroleum samples to provide further insight.
对二维气相色谱飞行时间质谱数据进行基于瓦片的fisher比分析,以获得许多石油基样品中所有检测到的分析物化合物的主峰表
从历史上看,综合二维气相色谱飞行时间质谱(GC × GC- tofms)数据的基于瓦片的Fisher ratio (F-ratio)分析是为分析人员开发的,用于使用具有定义样品类别的监督实验设计来获得命中列表,以发现在命中列表顶部最显著区分样品类别的分析物。在这个传统的应用程序中,使用用户指定的F-ratio阈值来丢弃大多数命中,以便专注于命中最多的命中。为了扩大基于瓦片的f比分析的范围,在本研究中,我们探索了软件发现在一组样品中检测到的所有分析物成分的能力,基本上充分利用了软件的瓦片方面,该软件发现了所有分析物,这些分析物相对于所有样品的基线噪声表现出足够的信号,被认为是可检测的,因此产生了f比。本研究同时分析了9种石油样品,即两种加氢产物(轻石脑油)、两种重整产物、四种石脑油和一种“重”汽油,并通过空白色谱的p检验进行统计比较,得出一个综合的攻击清单。最高m/z f比的pin位置和信号区域与重复空白一起用于生成主峰表(MPT),该主峰表反过来用于生成样品特异性峰表(SSPT),每个石油样品(类别)的每个注入重复都有一个SSPT,通过f比软件自然地保持时间对齐。这9个石油样品在特征和分析物数量上有很大的不同。事实上,虽然在所有9个样本中共发现了~ 715种分析物,但这些分析物中只有~ 260种在所有样本类别中完全共享。9个石油样品中分析物的数量从一种氢化物的平均335个分析物到两种石脑油的平均669个分析物不等。该工作流程还有助于生成9个石油样品的模拟蒸馏曲线,以提供进一步的见解。
本文章由计算机程序翻译,如有差异,请以英文原文为准。
求助全文
约1分钟内获得全文
求助全文
来源期刊

Journal of chromatography open
Analytical Chemistry
CiteScore
2.50
自引率
0.00%
发文量
0
审稿时长
50 days
 求助内容:
求助内容: 应助结果提醒方式:


