{"title":"A survival prediction model for biliary tract cancer based on least absolute shrinkage and selection operator-cox regression.","authors":"Shanshan Fan, Kexin Zhao, Ziwei Liang, Yang Ge","doi":"10.1080/07853890.2025.2555520","DOIUrl":null,"url":null,"abstract":"<p><strong>Background: </strong>Biliary tract cancer (BTC) is a digestive tract tumor with low incidence, high malignancy, and short survival times. Abnormal lipid metabolism may be related to the occurrence and development of tumors; therefore, we constructed a survival prediction model for patients with BTC using clinical data that included lipid indicators rarely considered in previous studies.</p><p><strong>Patients and methods: </strong>Clinical and pathological data were collected from 124 patients with BTC. Patients were divided into two groups according to the inclusion time. The training and validation cohorts included 70 patients from 2017 to 2021 and 54 patients from 2022 to 2023. Least absolute shrinkage and selection operator-Cox regression analysis was conducted on the survival data. The resulting prediction model was evaluated using discrimination and calibration analyses performed in R Studio.</p><p><strong>Results: </strong>Tumor location, lipoprotein (a), carcinoembryonic antigen, carbohydrate antigen 19-9, and therapy type were identified as key predictors for constructing the nomogram. The consistency indexes for the training and validation cohorts were 0.677 and 0.655, respectively, indicating moderate discrimination. The Hosmer-Lemeshow test provided a <i>p</i>-value of 0.188 for the validation cohort, suggesting a good model fit. The calibration accuracy of the model in the two cohorts was further evaluated by drawing calibration curves based on the follow-up time. Patients were classified into high- and low-risk groups according to the nomogram risk scores. Kaplan-Meier survival curves showed significant differences between the training cohort (<i>p</i> = 0.00041) and the validation cohort (<i>p</i> = 0.0028). The risk score scatter plot provided visual verification of the model's performance.</p><p><strong>Conclusions: </strong>The predictive model constructed in this retrospective study shows potential for guiding the clinical identification of groups at high risk of BTC, adjusting treatment intensity, and improving follow-up management.</p>","PeriodicalId":93874,"journal":{"name":"Annals of medicine","volume":"57 1","pages":"2555520"},"PeriodicalIF":4.3000,"publicationDate":"2025-12-01","publicationTypes":"Journal Article","fieldsOfStudy":null,"isOpenAccess":false,"openAccessPdf":"https://www.ncbi.nlm.nih.gov/pmc/articles/PMC12409905/pdf/","citationCount":"0","resultStr":null,"platform":"Semanticscholar","paperid":null,"PeriodicalName":"Annals of medicine","FirstCategoryId":"1085","ListUrlMain":"https://doi.org/10.1080/07853890.2025.2555520","RegionNum":0,"RegionCategory":null,"ArticlePicture":[],"TitleCN":null,"AbstractTextCN":null,"PMCID":null,"EPubDate":"2025/9/3 0:00:00","PubModel":"Epub","JCR":"","JCRName":"","Score":null,"Total":0}
引用次数: 0
Abstract
Background: Biliary tract cancer (BTC) is a digestive tract tumor with low incidence, high malignancy, and short survival times. Abnormal lipid metabolism may be related to the occurrence and development of tumors; therefore, we constructed a survival prediction model for patients with BTC using clinical data that included lipid indicators rarely considered in previous studies.
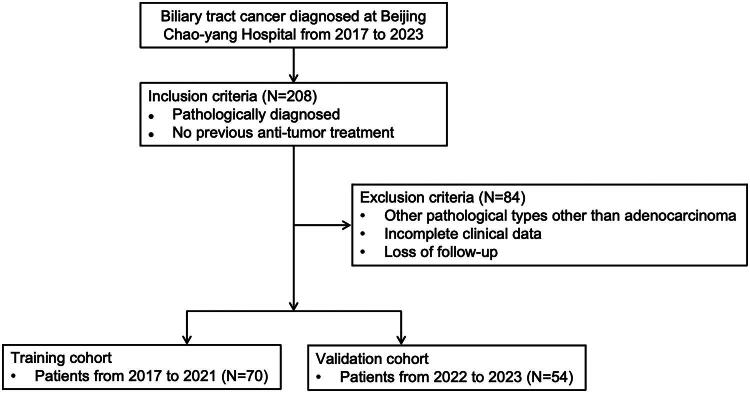
Patients and methods: Clinical and pathological data were collected from 124 patients with BTC. Patients were divided into two groups according to the inclusion time. The training and validation cohorts included 70 patients from 2017 to 2021 and 54 patients from 2022 to 2023. Least absolute shrinkage and selection operator-Cox regression analysis was conducted on the survival data. The resulting prediction model was evaluated using discrimination and calibration analyses performed in R Studio.
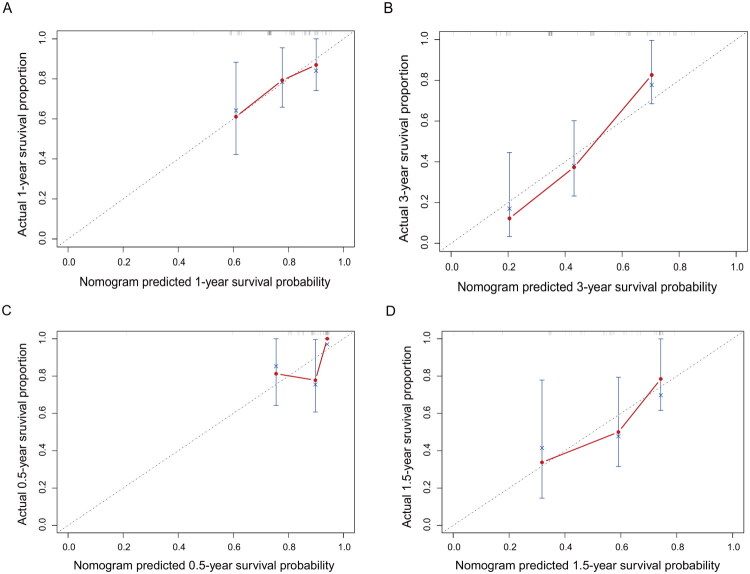
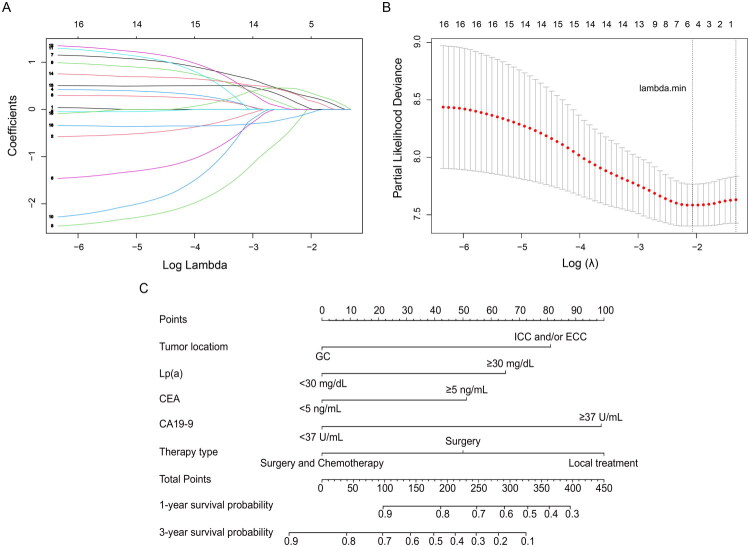
Results: Tumor location, lipoprotein (a), carcinoembryonic antigen, carbohydrate antigen 19-9, and therapy type were identified as key predictors for constructing the nomogram. The consistency indexes for the training and validation cohorts were 0.677 and 0.655, respectively, indicating moderate discrimination. The Hosmer-Lemeshow test provided a p-value of 0.188 for the validation cohort, suggesting a good model fit. The calibration accuracy of the model in the two cohorts was further evaluated by drawing calibration curves based on the follow-up time. Patients were classified into high- and low-risk groups according to the nomogram risk scores. Kaplan-Meier survival curves showed significant differences between the training cohort (p = 0.00041) and the validation cohort (p = 0.0028). The risk score scatter plot provided visual verification of the model's performance.
Conclusions: The predictive model constructed in this retrospective study shows potential for guiding the clinical identification of groups at high risk of BTC, adjusting treatment intensity, and improving follow-up management.

 求助内容:
求助内容: 应助结果提醒方式:


