{"title":"Investigating the Relationships Between COVID-19 Cases, Public Health Interventions, Vaccine Coverage, and Mean Temperature in Ontario and Toronto.","authors":"Melinaz Barati Chermahini, Vernon Hoeppner","doi":"10.3390/diseases13080269","DOIUrl":null,"url":null,"abstract":"<p><p><b>Background/Objectives:</b> We aimed to examine the relationship between COVID-19 cases and Public Health Interventions (PHIs), vaccine coverage, and temperature. We compared our findings with those of other studies that used different methodologies, such as mathematical models. <b>Methods</b>: We developed monthly PHI scores using the Oxford COVID-19 Government Response Tracker from May 2020 to May 2021. We calculated PHI scores by summing the highest monthly score of each intervention and expressed the PHI score as a percentage of the maximum. We obtained vaccine coverage and temperature data from January 2021 to September 2023. We calculated Spearman's rank-order correlation coefficients to examine correlations. <b>Results</b>: The correlation between cases and PHI was positive (ρ = 0.947, <i>p</i> < 0.0001). The correlation between cases and vaccine coverage was approximately zero (ρ = 0.0165, <i>p</i> = 0.957) from January 2021 to January 2022 and was negative from February 2022 to September 2023 (ρ= -0.816, <i>p</i> < 0.0001). The correlation for cases and temperature was negative from January 2021 to January 2022 (ρ = -0.676, <i>p</i> = 0.0112) and was almost zero from February 2022 to September 2023 (ρ = -0.162, <i>p</i> = 0.494). The models showed a negative correlation between PHI and vaccine coverage, and mixed results for temperature. <b>Conclusions</b>: There was a positive correlation between cases and PHI. Prior to reaching the vaccine threshold coverage, there was no correlation for vaccination and a negative correlation for temperature. Post-vaccine threshold, there was a negative correlation for vaccination and no correlation for temperature. Correlation results for PHI and temperature differed from those of the mathematical models.</p>","PeriodicalId":72832,"journal":{"name":"Diseases (Basel, Switzerland)","volume":"13 8","pages":""},"PeriodicalIF":3.0000,"publicationDate":"2025-08-19","publicationTypes":"Journal Article","fieldsOfStudy":null,"isOpenAccess":false,"openAccessPdf":"https://www.ncbi.nlm.nih.gov/pmc/articles/PMC12385227/pdf/","citationCount":"0","resultStr":null,"platform":"Semanticscholar","paperid":null,"PeriodicalName":"Diseases (Basel, Switzerland)","FirstCategoryId":"1085","ListUrlMain":"https://doi.org/10.3390/diseases13080269","RegionNum":0,"RegionCategory":null,"ArticlePicture":[],"TitleCN":null,"AbstractTextCN":null,"PMCID":null,"EPubDate":"","PubModel":"","JCR":"Q2","JCRName":"MEDICINE, RESEARCH & EXPERIMENTAL","Score":null,"Total":0}
引用次数: 0
Abstract
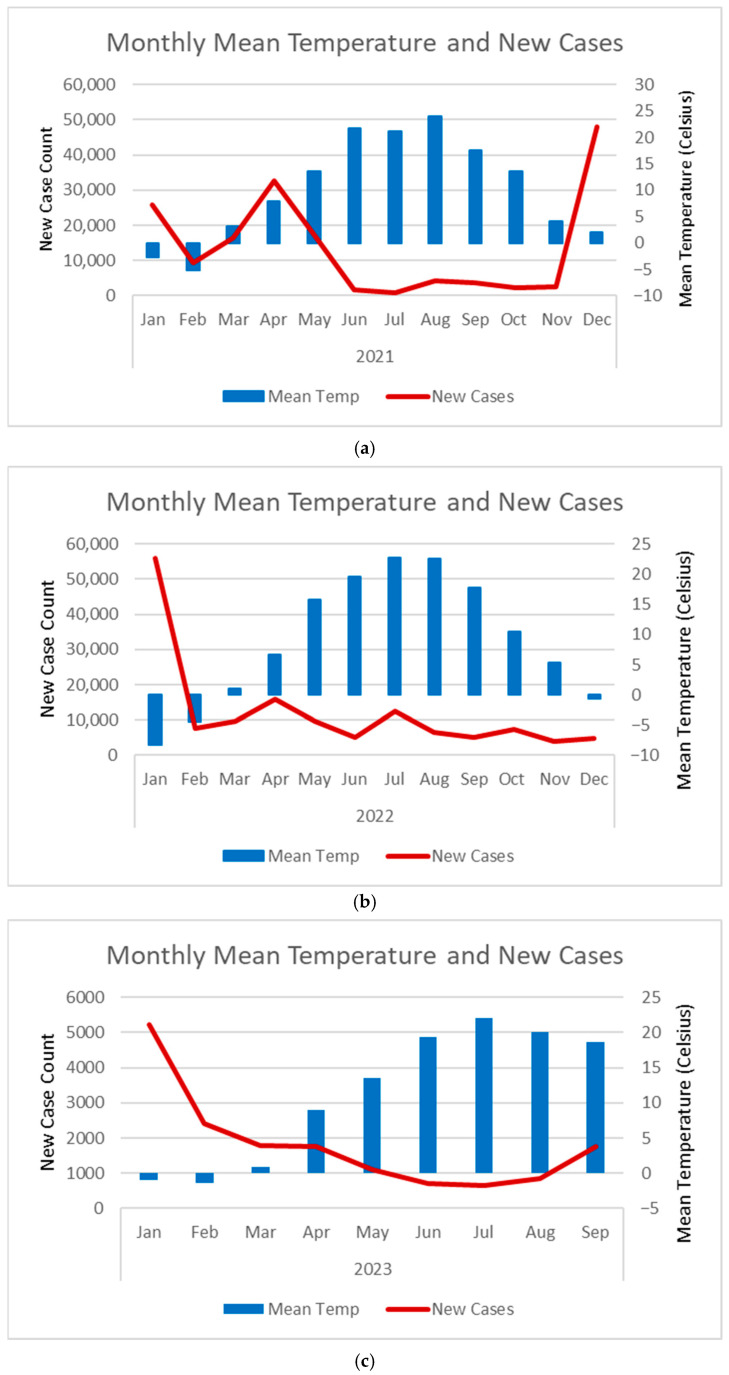
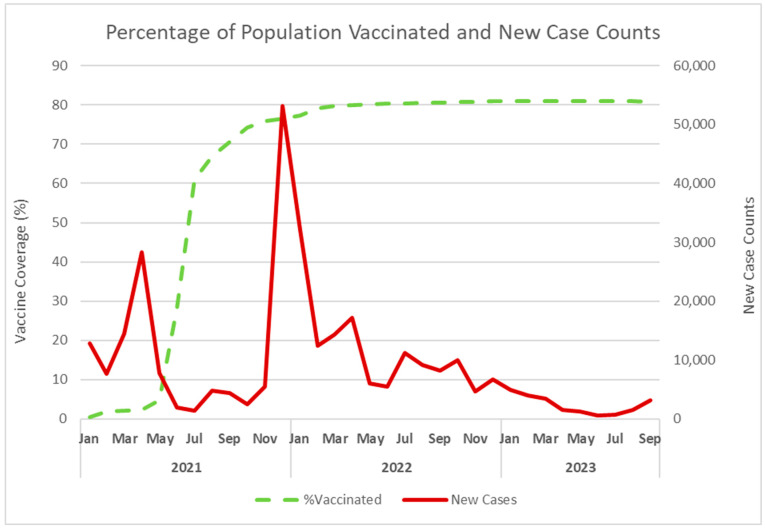
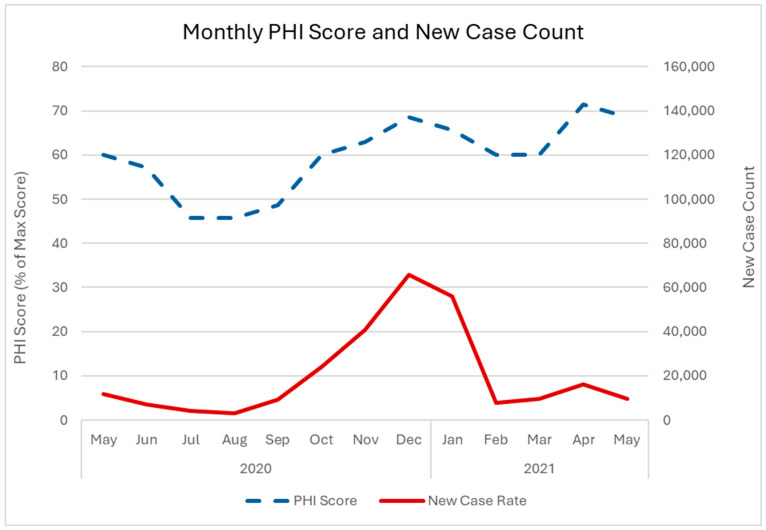
Background/Objectives: We aimed to examine the relationship between COVID-19 cases and Public Health Interventions (PHIs), vaccine coverage, and temperature. We compared our findings with those of other studies that used different methodologies, such as mathematical models. Methods: We developed monthly PHI scores using the Oxford COVID-19 Government Response Tracker from May 2020 to May 2021. We calculated PHI scores by summing the highest monthly score of each intervention and expressed the PHI score as a percentage of the maximum. We obtained vaccine coverage and temperature data from January 2021 to September 2023. We calculated Spearman's rank-order correlation coefficients to examine correlations. Results: The correlation between cases and PHI was positive (ρ = 0.947, p < 0.0001). The correlation between cases and vaccine coverage was approximately zero (ρ = 0.0165, p = 0.957) from January 2021 to January 2022 and was negative from February 2022 to September 2023 (ρ= -0.816, p < 0.0001). The correlation for cases and temperature was negative from January 2021 to January 2022 (ρ = -0.676, p = 0.0112) and was almost zero from February 2022 to September 2023 (ρ = -0.162, p = 0.494). The models showed a negative correlation between PHI and vaccine coverage, and mixed results for temperature. Conclusions: There was a positive correlation between cases and PHI. Prior to reaching the vaccine threshold coverage, there was no correlation for vaccination and a negative correlation for temperature. Post-vaccine threshold, there was a negative correlation for vaccination and no correlation for temperature. Correlation results for PHI and temperature differed from those of the mathematical models.
背景/目的:我们旨在研究COVID-19病例与公共卫生干预措施(PHIs)、疫苗覆盖率和温度之间的关系。我们将我们的发现与其他使用不同方法(如数学模型)的研究结果进行了比较。方法:从2020年5月至2021年5月,我们使用牛津COVID-19政府反应追踪器编制了每月PHI评分。我们通过将每个干预的最高月度得分相加来计算PHI分数,并将PHI分数表示为最大值的百分比。我们获得了2021年1月至2023年9月的疫苗覆盖率和温度数据。我们计算了Spearman的秩序相关系数来检验相关性。结果:病例数与PHI呈正相关(ρ = 0.947, p < 0.0001)。从2021年1月至2022年1月,病例与疫苗覆盖率之间的相关性近似为零(ρ= 0.0165, p = 0.957),从2022年2月至2023年9月,病例与疫苗覆盖率之间的相关性为负(ρ= -0.816, p < 0.0001)。2021年1月至2022年1月,病例数与气温的相关性为负(ρ = -0.676, p = 0.0112), 2022年2月至2023年9月,病例数与气温的相关性几乎为零(ρ = -0.162, p = 0.494)。模型显示PHI与疫苗覆盖率呈负相关,而温度的结果则好坏参半。结论:病例与PHI呈正相关。在达到疫苗阈值覆盖率之前,疫苗接种与温度呈负相关。疫苗接种后阈值与疫苗接种呈负相关,与温度无相关性。PHI与温度的相关结果与数学模型的结果不同。

 求助内容:
求助内容: 应助结果提醒方式:


