{"title":"Content Analysis of Instagram Stories of Top Plastic Surgeons.","authors":"Olivia C MacIntyre, Colton Boudreau, Alison Wong","doi":"10.1093/asjof/ojaf051","DOIUrl":null,"url":null,"abstract":"<p><p>Instagram stories (Meta, Menlo Park, CA) are posted at higher volumes and incite increased engagement for accounts. This is because of Instagram's algorithm, which typically only shows static posts to 10% of an account's followers. Given the importance of social media in cosmetic surgery practices, a detailed analysis of trends is useful in guiding plastic surgeon marketing regimes. The aim of the authors of this study is to provide a detailed analysis of Instagram story content posted by top 100 most-followed plastic surgeons in the world. One hundred plastic surgery Instagram accounts in the world were identified by their total number of followers and using the keywords \"plastic,\" \"cosmetic,\" \"aesthetic,\" and \"surgeon.\" Accounts of each surgeon were monitored daily over 1 week, with story content categorically logged. Broad categories included personal, educational, surgical, and engagement, which were further divided into subcategories. Qualitative and quantitative measures were used to assess demographics and trends. The average number of followers by the top accounts was 437,917 ± 36,216. The majority of accounts were located in North America (64%). The average number of stories posted each week was 28.2 ± 3.7, with the highest number posted on Friday (5.01) and the lowest on Saturday (2.67). The most common content of stories posted was related to surgical procedures (57.6%), contributing 1577 total stories. In this descriptive study, the authors provide insight into the nature of Instagram story content posted by top-followed plastic surgeons in the world, providing guidance to new and existing plastic surgeons in their social media practices. <b>Level of Evidence: 5 (Therapeutic)</b>.</p>","PeriodicalId":72118,"journal":{"name":"Aesthetic surgery journal. Open forum","volume":"7 ","pages":"ojaf051"},"PeriodicalIF":1.9000,"publicationDate":"2025-07-31","publicationTypes":"Journal Article","fieldsOfStudy":null,"isOpenAccess":false,"openAccessPdf":"https://www.ncbi.nlm.nih.gov/pmc/articles/PMC12368952/pdf/","citationCount":"0","resultStr":null,"platform":"Semanticscholar","paperid":null,"PeriodicalName":"Aesthetic surgery journal. Open forum","FirstCategoryId":"1085","ListUrlMain":"https://doi.org/10.1093/asjof/ojaf051","RegionNum":0,"RegionCategory":null,"ArticlePicture":[],"TitleCN":null,"AbstractTextCN":null,"PMCID":null,"EPubDate":"2025/1/1 0:00:00","PubModel":"eCollection","JCR":"","JCRName":"","Score":null,"Total":0}
引用次数: 0
Abstract
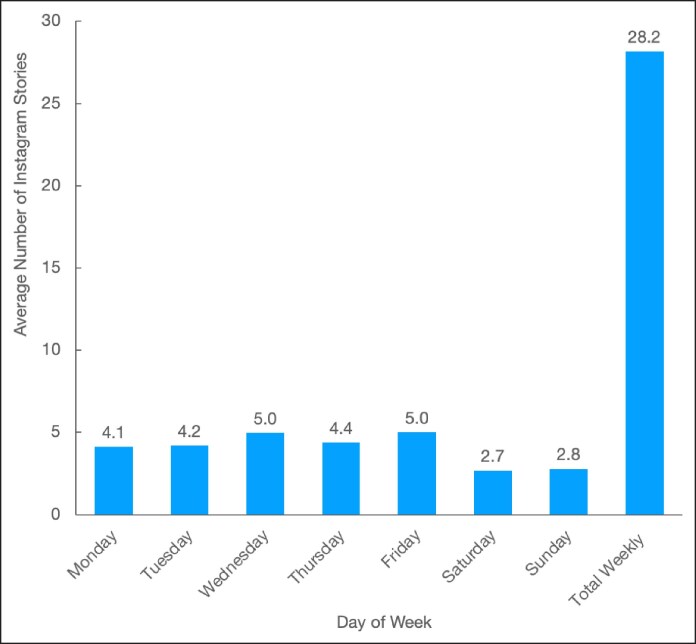
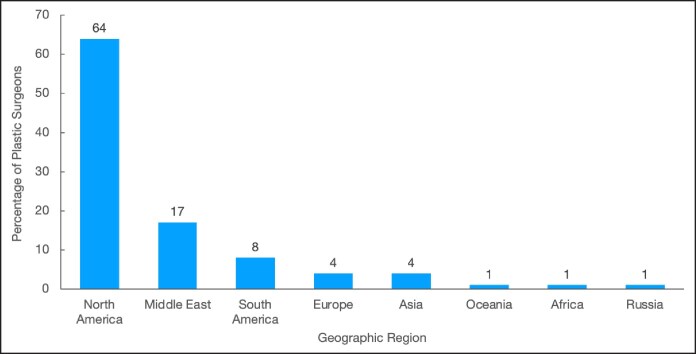
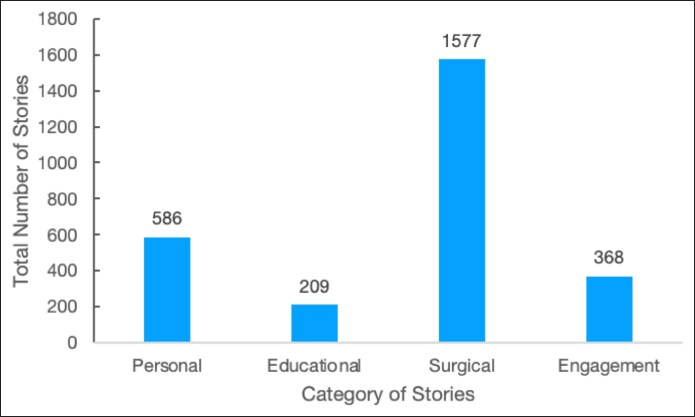
Instagram stories (Meta, Menlo Park, CA) are posted at higher volumes and incite increased engagement for accounts. This is because of Instagram's algorithm, which typically only shows static posts to 10% of an account's followers. Given the importance of social media in cosmetic surgery practices, a detailed analysis of trends is useful in guiding plastic surgeon marketing regimes. The aim of the authors of this study is to provide a detailed analysis of Instagram story content posted by top 100 most-followed plastic surgeons in the world. One hundred plastic surgery Instagram accounts in the world were identified by their total number of followers and using the keywords "plastic," "cosmetic," "aesthetic," and "surgeon." Accounts of each surgeon were monitored daily over 1 week, with story content categorically logged. Broad categories included personal, educational, surgical, and engagement, which were further divided into subcategories. Qualitative and quantitative measures were used to assess demographics and trends. The average number of followers by the top accounts was 437,917 ± 36,216. The majority of accounts were located in North America (64%). The average number of stories posted each week was 28.2 ± 3.7, with the highest number posted on Friday (5.01) and the lowest on Saturday (2.67). The most common content of stories posted was related to surgical procedures (57.6%), contributing 1577 total stories. In this descriptive study, the authors provide insight into the nature of Instagram story content posted by top-followed plastic surgeons in the world, providing guidance to new and existing plastic surgeons in their social media practices. Level of Evidence: 5 (Therapeutic).

 求助内容:
求助内容: 应助结果提醒方式:


