Himani Yadav, Elvis D. Okoffo, Dario Caro, Alessandro Galli and Syeed Md Iskander*,
{"title":"The Plastic Footprint of Fruit Packaging: Strategies for Minimizing Climate Impacts via Optimizing Packaging Design and Use","authors":"Himani Yadav, Elvis D. Okoffo, Dario Caro, Alessandro Galli and Syeed Md Iskander*, ","doi":"10.1021/acssusresmgt.5c00185","DOIUrl":null,"url":null,"abstract":"<p >Plastic packaging is unavoidable in the fruit supply chain; yet, its footprint remains a concern. We assessed the plastic footprint of fruit packaging by evaluating the packaging type, size, and polymer composition. CO<sub>2</sub> content was used as a proxy for plastic footprint, reflecting the plastics embodied in packaging and enabling consistent impact assessment. Eighteen fruit varieties were surveyed across U.S. supermarkets, primarily found in five packaging forms: open stock, bagged, boxed, bottled, and wrapped. Smaller packages had a higher CO<sub>2</sub> content per unit weight of fruits, emphasizing the importance of the packaging-to-product ratio. An exponential decline (<i>p</i> < 0.05) was observed between fruit weight and normalized CO<sub>2</sub> content in boxed and bagged packaging. Reducing the package size from 1–2 kg to 0.1–0.25 kg increased the normalized plastic footprint by 98%. Open stock bags had the lowest CO<sub>2</sub> content (2.28 ± 0.02 g/kg of fruit), though often requiring checkout bags that can triple the footprint. Boxed packaging showed the highest footprint (168.53 ± 41.51 g of CO<sub>2</sub>/kg), with a polymer content of 49.39 ± 17.72 g of PET/kg, 1.34 ± 0.72 g of PE/kg, 0.26 ± 0.11 g of PS/kg, and 1.58 ± 0.53 g of PVC/kg. These findings highlight the need for mono-material packaging and improved design standards that prioritize the packaging-to-product ratio to reduce plastic footprint in the fruit supply chain.</p>","PeriodicalId":100015,"journal":{"name":"ACS Sustainable Resource Management","volume":"2 8","pages":"1425–1436"},"PeriodicalIF":0.0000,"publicationDate":"2025-07-16","publicationTypes":"Journal Article","fieldsOfStudy":null,"isOpenAccess":false,"openAccessPdf":"","citationCount":"0","resultStr":null,"platform":"Semanticscholar","paperid":null,"PeriodicalName":"ACS Sustainable Resource Management","FirstCategoryId":"1085","ListUrlMain":"https://pubs.acs.org/doi/10.1021/acssusresmgt.5c00185","RegionNum":0,"RegionCategory":null,"ArticlePicture":[],"TitleCN":null,"AbstractTextCN":null,"PMCID":null,"EPubDate":"","PubModel":"","JCR":"","JCRName":"","Score":null,"Total":0}
引用次数: 0
Abstract
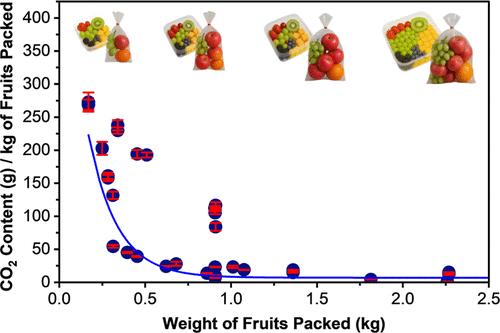
Plastic packaging is unavoidable in the fruit supply chain; yet, its footprint remains a concern. We assessed the plastic footprint of fruit packaging by evaluating the packaging type, size, and polymer composition. CO2 content was used as a proxy for plastic footprint, reflecting the plastics embodied in packaging and enabling consistent impact assessment. Eighteen fruit varieties were surveyed across U.S. supermarkets, primarily found in five packaging forms: open stock, bagged, boxed, bottled, and wrapped. Smaller packages had a higher CO2 content per unit weight of fruits, emphasizing the importance of the packaging-to-product ratio. An exponential decline (p < 0.05) was observed between fruit weight and normalized CO2 content in boxed and bagged packaging. Reducing the package size from 1–2 kg to 0.1–0.25 kg increased the normalized plastic footprint by 98%. Open stock bags had the lowest CO2 content (2.28 ± 0.02 g/kg of fruit), though often requiring checkout bags that can triple the footprint. Boxed packaging showed the highest footprint (168.53 ± 41.51 g of CO2/kg), with a polymer content of 49.39 ± 17.72 g of PET/kg, 1.34 ± 0.72 g of PE/kg, 0.26 ± 0.11 g of PS/kg, and 1.58 ± 0.53 g of PVC/kg. These findings highlight the need for mono-material packaging and improved design standards that prioritize the packaging-to-product ratio to reduce plastic footprint in the fruit supply chain.
塑料包装在水果供应链中是不可避免的;然而,它的足迹仍然令人担忧。我们通过评估包装类型、尺寸和聚合物组成来评估水果包装的塑料足迹。二氧化碳含量被用作塑料足迹的代表,反映了包装中体现的塑料,并实现了一致的影响评估。美国超市调查了18种水果品种,主要有五种包装形式:开放式库存、袋装、盒装、瓶装和包装。较小的包装每单位重量的水果有较高的二氧化碳含量,强调包装与产品比例的重要性。在盒装和袋装包装中,果实重量和标准化二氧化碳含量呈指数下降(p < 0.05)。将包装尺寸从1-2公斤减少到0.1-0.25公斤,标准化塑料足迹增加了98%。开放式库存袋的二氧化碳含量最低(2.28±0.02克/公斤水果),尽管通常需要结账袋,可以三倍的足迹。盒装包装的碳足迹最高(168.53±41.51 g CO2/kg), PET含量为49.39±17.72 g /kg, PE含量为1.34±0.72 g /kg, PS含量为0.26±0.11 g /kg, PVC含量为1.58±0.53 g /kg。这些发现强调了单一材料包装和改进设计标准的必要性,优先考虑包装与产品的比例,以减少水果供应链中的塑料足迹。

 求助内容:
求助内容: 应助结果提醒方式:


