Attribution of regional Hadley circulation intensity changes in the Northern Hemisphere
IF 3.2
4区 地球科学
Q3 METEOROLOGY & ATMOSPHERIC SCIENCES
引用次数: 0
Abstract
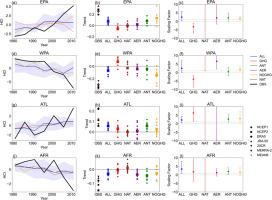
The discrepancy in the trends of the global zonal mean (GZM) intensity of the Hadley circulation (HCI) between reanalysis data and model simulations has been a problem for understanding the changes in HCI and the influence of external forcings. To understand the reason for this discrepancy, this study investigates the trends of intensity of regional HCI of the Northern Hemisphere over the eastern Pacific (EPA), western Pacific (WPA), Atlantic (ATL), Africa (AFR), the Indian Ocean (IDO), and residual area (RA), based on six reanalysis datasets and 13 CMIP6 models. In reanalysis data, the trends in regional HCI over EPA and ATL (WPA and AFR) contribute to (partially offset) the increasing trend in GZM HCI, while the trends in regional HCI over IDO are different in different reanalysis data. The CMIP6 models skillfully reproduce the trends in regional HCI over EPA, ATL, WPA, and AFR, but simulate notable decreasing trends in regional HCI over IDO, which is a key reason for the opposite trends in GZM HCI between reanalysis data and models. The discrepancy in IDO can be attributed to differences in the simulation of diabatic heating and zonal friction between reanalysis data and models. Optimal fingerprint analysis indicates that anthropogenic (ANT) and non-greenhouse gas (NOGHG) forcings are the dominant drivers of the HCI trends in the EPA and ATL regions. In the WPA (AFR) region, NOGHG (ANT) forcing serves as the primary driver. The findings contribute to improving the representation of regional HCI trends in models and improving the attribution of external forcings.
摘要
基于6套再分析资料和13个CMIP6模式, 研究发现模式能够较好地再现北半球东太平洋, 西太平洋, 大西洋和非洲的哈德来环流强度变化趋势. 但在印度洋区域, 再分析数据与模式模拟的趋势存在较大差异. 这一差异主要归因于模式与再分析数据在非绝热加热和纬向摩擦力模拟上的不同表现. 最优指纹法分析表明, 人为强迫和非温室气体强迫是北半球局地哈德来环流强度变化的主要驱动因素. 本研究揭示了人类活动对北半球不同区域哈德来环流变化的重要影响, 并阐明了再分析资料与CMIP6模式中北半球哈德来环流变化差异的原因.
北半球区域Hadley环流强度变化的归因
再分析资料与模式模拟的全球纬向平均哈德利环流(HCI)强度趋势的差异一直是理解HCI变化和外部强迫影响的一个问题。为了了解这种差异的原因,本研究基于6个再分析数据集和13个CMIP6模式,研究了北半球在东太平洋(EPA)、西太平洋(WPA)、大西洋(ATL)、非洲(AFR)、印度洋(IDO)和残差区(RA)的区域HCI强度变化趋势。在再分析数据中,EPA和ATL (WPA和AFR)的区域HCI趋势有助于(部分抵消)GZM HCI的增加趋势,而IDO的区域HCI趋势在不同的再分析数据中有所不同。CMIP6模型巧妙地再现了EPA、ATL、WPA和AFR区域HCI的变化趋势,但模拟了IDO区域HCI的显著下降趋势,这是GZM再分析数据和模型之间HCI趋势相反的关键原因。IDO的差异可归因于再分析数据与模式在绝热加热和纬向摩擦模拟方面的差异。最优指纹分析表明,人为(ANT)和非温室气体(NOGHG)强迫是EPA和ATL地区HCI趋势的主要驱动因素。在WPA (AFR)地区,NOGHG (ANT)强迫是主要驱动力。这些发现有助于提高模式中区域人力资本投入趋势的代表性,并改善外部强迫的归因。摘要基于6套再分析资料和13个CMIP6模式,研究发现模式能够较好地再现北半球东太平洋,西太平洋,大西洋和非洲的哈德来环流强度变化趋势。但在印度洋区域, 再分析数据与模式模拟的趋势存在较大差异. 这一差异主要归因于模式与再分析数据在非绝热加热和纬向摩擦力模拟上的不同表现. 最优指纹法分析表明, 人为强迫和非温室气体强迫是北半球局地哈德来环流强度变化的主要驱动因素. 本研究揭示了人类活动对北半球不同区域哈德来环流变化的重要影响,并阐明了再分析资料与CMIP6模式中北半球哈德来环流变化差异的原因。
本文章由计算机程序翻译,如有差异,请以英文原文为准。
求助全文
约1分钟内获得全文
求助全文
来源期刊

Atmospheric and Oceanic Science Letters
METEOROLOGY & ATMOSPHERIC SCIENCES-
CiteScore
4.20
自引率
8.70%
发文量
925
审稿时长
12 weeks
 求助内容:
求助内容: 应助结果提醒方式:


