{"title":"Evaluating upper leg muscle volume : the reliability of thigh circumference measurement 10 cm above the patella.","authors":"Sotaro Kono, Kazuma Takashima, Keisuke Uemura, Hirokazu Mae, Keishi Takagi, Mazen Soufi, Yoshito Otake, Yoshinobu Sato, Nobuhiko Sugano, Seiji Okada, Hidetoshi Hamada","doi":"10.1302/2046-3758.148.BJR-2024-0216.R2","DOIUrl":null,"url":null,"abstract":"<p><strong>Aims: </strong>To use CT images and segmentation of the skin and muscles of the upper leg to determine a reliable location for measuring thigh circumference (TC) to assess the upper leg muscle volume and cross-sectional area (CSA).</p><p><strong>Methods: </strong>This research analyzed 140 limbs from 77 patients (22 male and 55 female) who had undergone CT imaging before hip surgery. The skin and individual upper leg muscles were automatically segmented from the CT images to measure the TC and CSA of each upper leg muscle across all axial slices. TC and CSA were measured from the patella upward at 1 cm up to 20 cm intervals, resulting in 21 analyses per limb. The volume of each muscle was calculated by adding the CSAs across all axial slices. Pearson's correlation was used to analyze the relationship between muscle volume and CSA to identify the level with the strongest correlation as the \"reliable\" level. The correlation coefficient and the regression equation were calculated.</p><p><strong>Results: </strong>The reliable level for muscle CSAs exhibiting the strongest correlation varied across the muscles, ranging from 9 to 20 cm from the patella. However, strong correlations were found between each muscle's TC, ranging from 0.64 to 0.83. In terms of muscle volume, 10 cm above the patella was found to be the reasonable level for predicting the volume of each muscle from TC. Moderate to strong correlations (ranging from 0.57 to 0.70) were found between the TC. To predict the muscle volume of the whole upper leg (cm³), the following equation was used: (TC at 10 cm from the patella) × 114.7-2,194.9.</p><p><strong>Conclusion: </strong>TC measurement 10 cm above the patella is suitable for assessing upper leg muscle volume. Modifications in measurement levels across muscles may be needed to assess muscle CSAs.</p>","PeriodicalId":9074,"journal":{"name":"Bone & Joint Research","volume":"14 8","pages":"666-673"},"PeriodicalIF":5.1000,"publicationDate":"2025-08-01","publicationTypes":"Journal Article","fieldsOfStudy":null,"isOpenAccess":false,"openAccessPdf":"https://www.ncbi.nlm.nih.gov/pmc/articles/PMC12313360/pdf/","citationCount":"0","resultStr":null,"platform":"Semanticscholar","paperid":null,"PeriodicalName":"Bone & Joint Research","FirstCategoryId":"3","ListUrlMain":"https://doi.org/10.1302/2046-3758.148.BJR-2024-0216.R2","RegionNum":2,"RegionCategory":"医学","ArticlePicture":[],"TitleCN":null,"AbstractTextCN":null,"PMCID":null,"EPubDate":"","PubModel":"","JCR":"Q2","JCRName":"CELL & TISSUE ENGINEERING","Score":null,"Total":0}
引用次数: 0
Abstract
Aims: To use CT images and segmentation of the skin and muscles of the upper leg to determine a reliable location for measuring thigh circumference (TC) to assess the upper leg muscle volume and cross-sectional area (CSA).
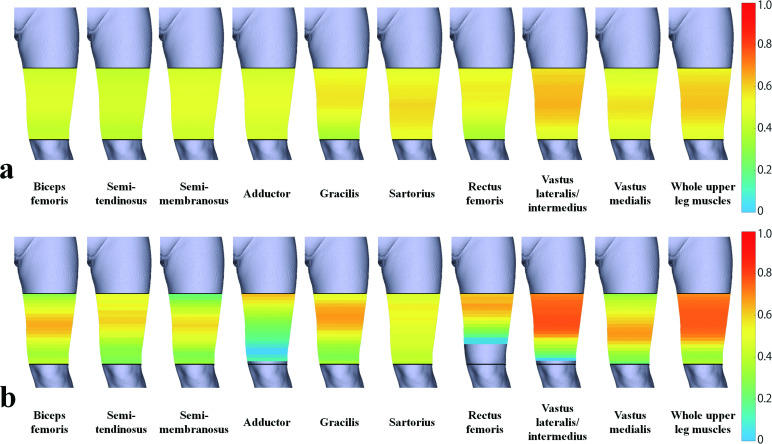
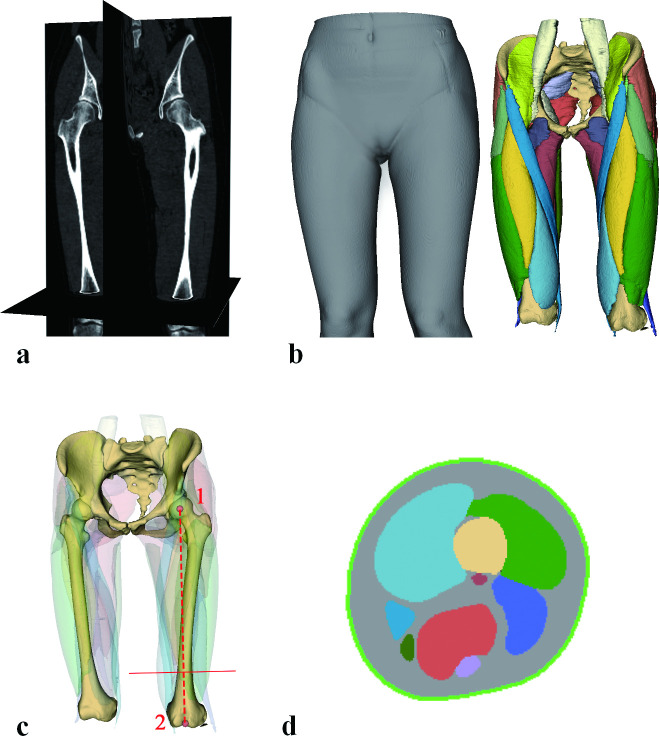
Methods: This research analyzed 140 limbs from 77 patients (22 male and 55 female) who had undergone CT imaging before hip surgery. The skin and individual upper leg muscles were automatically segmented from the CT images to measure the TC and CSA of each upper leg muscle across all axial slices. TC and CSA were measured from the patella upward at 1 cm up to 20 cm intervals, resulting in 21 analyses per limb. The volume of each muscle was calculated by adding the CSAs across all axial slices. Pearson's correlation was used to analyze the relationship between muscle volume and CSA to identify the level with the strongest correlation as the "reliable" level. The correlation coefficient and the regression equation were calculated.
Results: The reliable level for muscle CSAs exhibiting the strongest correlation varied across the muscles, ranging from 9 to 20 cm from the patella. However, strong correlations were found between each muscle's TC, ranging from 0.64 to 0.83. In terms of muscle volume, 10 cm above the patella was found to be the reasonable level for predicting the volume of each muscle from TC. Moderate to strong correlations (ranging from 0.57 to 0.70) were found between the TC. To predict the muscle volume of the whole upper leg (cm³), the following equation was used: (TC at 10 cm from the patella) × 114.7-2,194.9.
Conclusion: TC measurement 10 cm above the patella is suitable for assessing upper leg muscle volume. Modifications in measurement levels across muscles may be needed to assess muscle CSAs.
 求助内容:
求助内容: 应助结果提醒方式:


