{"title":"Comparison of Vernier Acuity Measured with Three Different Water-induced Blur Simulation Methods.","authors":"Vivek Suganthan Ramasubramanian, Aiswaryah Radhakrishnan","doi":"10.18502/jovr.v20.13887","DOIUrl":null,"url":null,"abstract":"<p><strong>Purpose: </strong>Human vision is subnormal in an aquatic environment, and studies have used different methods to measure visual functions with water-induced blur (WIB). In this study, we compared vernier acuity measured using three different WIB simulation methods.</p><p><strong>Methods: </strong>Sixty young adults (20 in each group) with best-corrected visual acuity of <math><mo>≥</mo></math> 6/6 participated in the study. Three different methods, one for each study group, were used to simulate WIB in order to measure the vernier acuity. The methods comprised M1: a glass tank filled with water containing a wave motor to produce waves, M2: a sprinkler with uncontrolled water splash against the glass, and M3: a sprinkler with controlled water splash against the glass. For each of the three methods, vernier acuity was measured binocularly (three trials of 50 presentations each) both at baseline (without simulated WIB) in the absence of WIB and under simulated WIB. This was conducted using FrACT presented on the Display++ monitor at a distance of 2 meters from the participant. The vernier target consisted of two vertical lines (1 x 15 arcmin) with a vertical separation of 0.5 arcmin.</p><p><strong>Results: </strong>The mean baseline vernier acuity (arcsec) was found to be similar (F<sup>[2, 57]</sup> = 0.20, <i>P</i> = 0.82) among all three groups (M1: 13.28 <math><mo>±</mo></math> 5.84, M2: 14.44 <math><mo>±</mo></math> 6.34, M3: 14.05 <math><mo>±</mo></math> 3.28). Vernier acuity with simulated WIB was least degraded with M1 (19.84 <math><mo>±</mo></math> 8.40) and more degraded with M2 (288.74 <math><mo>±</mo></math> 56.61), followed by M3 (49.14 <math><mo>±</mo></math> 20.13). One-way ANOVA revealed a significant difference among the three methods (F [2, 57] = 354.72, <i>P</i> <math><mo><</mo></math> 0.001).</p><p><strong>Conclusion: </strong>Our results suggest that the impact of simulated WIB on vernier acuity is not comparable due to differences in the strength of blur and the varied spatial and temporal properties of different simulated WIB methods. This emphasizes the need to develop a blur metric specific to WIB to objectively quantify its effect on different visual functions.</p>","PeriodicalId":16586,"journal":{"name":"Journal of Ophthalmic & Vision Research","volume":"20 ","pages":""},"PeriodicalIF":1.5000,"publicationDate":"2025-07-21","publicationTypes":"Journal Article","fieldsOfStudy":null,"isOpenAccess":false,"openAccessPdf":"https://www.ncbi.nlm.nih.gov/pmc/articles/PMC12284606/pdf/","citationCount":"0","resultStr":null,"platform":"Semanticscholar","paperid":null,"PeriodicalName":"Journal of Ophthalmic & Vision Research","FirstCategoryId":"1085","ListUrlMain":"https://doi.org/10.18502/jovr.v20.13887","RegionNum":0,"RegionCategory":null,"ArticlePicture":[],"TitleCN":null,"AbstractTextCN":null,"PMCID":null,"EPubDate":"2025/1/1 0:00:00","PubModel":"eCollection","JCR":"Q3","JCRName":"OPHTHALMOLOGY","Score":null,"Total":0}
引用次数: 0
Abstract
Purpose: Human vision is subnormal in an aquatic environment, and studies have used different methods to measure visual functions with water-induced blur (WIB). In this study, we compared vernier acuity measured using three different WIB simulation methods.
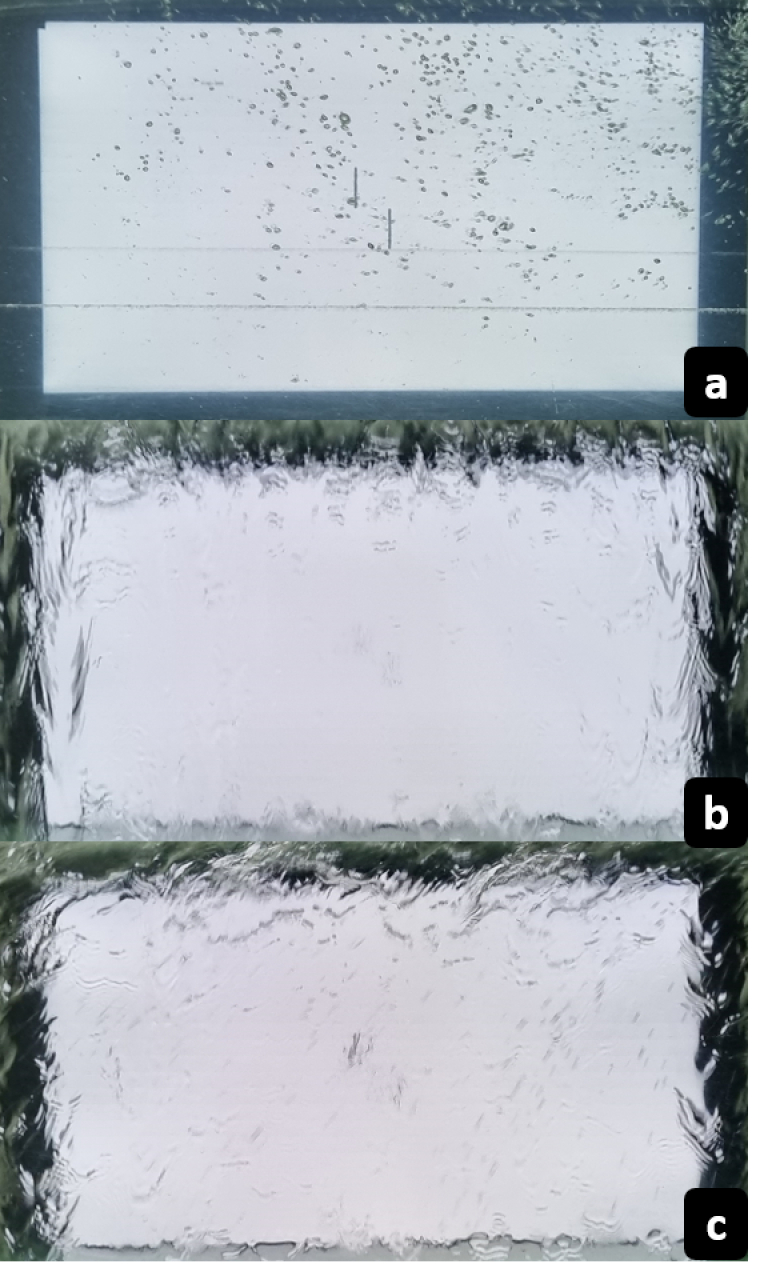
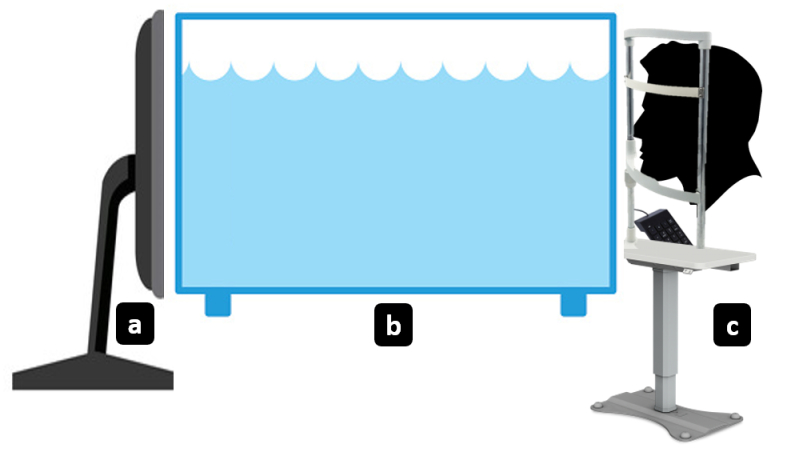
Methods: Sixty young adults (20 in each group) with best-corrected visual acuity of 6/6 participated in the study. Three different methods, one for each study group, were used to simulate WIB in order to measure the vernier acuity. The methods comprised M1: a glass tank filled with water containing a wave motor to produce waves, M2: a sprinkler with uncontrolled water splash against the glass, and M3: a sprinkler with controlled water splash against the glass. For each of the three methods, vernier acuity was measured binocularly (three trials of 50 presentations each) both at baseline (without simulated WIB) in the absence of WIB and under simulated WIB. This was conducted using FrACT presented on the Display++ monitor at a distance of 2 meters from the participant. The vernier target consisted of two vertical lines (1 x 15 arcmin) with a vertical separation of 0.5 arcmin.
Results: The mean baseline vernier acuity (arcsec) was found to be similar (F[2, 57] = 0.20, P = 0.82) among all three groups (M1: 13.28 5.84, M2: 14.44 6.34, M3: 14.05 3.28). Vernier acuity with simulated WIB was least degraded with M1 (19.84 8.40) and more degraded with M2 (288.74 56.61), followed by M3 (49.14 20.13). One-way ANOVA revealed a significant difference among the three methods (F [2, 57] = 354.72, P 0.001).
Conclusion: Our results suggest that the impact of simulated WIB on vernier acuity is not comparable due to differences in the strength of blur and the varied spatial and temporal properties of different simulated WIB methods. This emphasizes the need to develop a blur metric specific to WIB to objectively quantify its effect on different visual functions.

 求助内容:
求助内容: 应助结果提醒方式:


