{"title":"The relationship between radiomic features in CT images and the salivary gland SPECT/CT standardised uptake value using 3D analysis.","authors":"Yusaku Miki, Ichiro Ogura","doi":"10.5114/pjr/202590","DOIUrl":null,"url":null,"abstract":"<p><strong>Purpose: </strong>This study aimed to investigate the relationship between radiomic features extracted from computed tomography (CT) images and the mean standardised uptake value (SUV<sub>mean</sub>) obtained from salivary gland single-photon emission computed tomography (SPECT/CT), focusing on differences between Sjögren's syndrome and submandibular sialolithiasis.</p><p><strong>Material and methods: </strong>Thirteen patients (7 with Sjögren's syndrome and 6 with submandibular sialolithiasis) underwent CT and SPECT/CT imaging. SUV<sub>mean</sub> was calculated pre- and post-stimulation using technetium-99 m. Radiomic features were extracted from CT images using PyRadiomics, excluding shape-related features due to the impact of metal artifacts. Spearman's correlation coefficients were used to evaluate the relationship between pre/poststimulation SUV<sub>mean</sub> ratios and radiomic features. Regression models were created for features strongly correlated with SUV<sub>mean</sub> ratios.</p><p><strong>Results: </strong>The median pre/post SUV<sub>mean</sub> ratios were 1.30 (1.02-1.57) for Sjögren's syndrome and 2.35 (2.23-3.01) for sialolithiasis. In Sjögren's syndrome, 4 radiomic features correlated strongly with the SUV<sub>mean</sub> ratio: busyness (<i>r</i> = 0.78, <i>p</i> < 0.01), energy (<i>r</i> = 0.70, <i>p</i> < 0.01), total energy (<i>r</i> = 0.66, <i>p</i> = 0.01), and high grey level emphasis (<i>r</i> = -0.60, <i>p</i> = 0.02). No significant correlations were observed in sialolithiasis.</p><p><strong>Conclusions: </strong>Specific radiomic features in CT images showed strong correlations with SUV ratios in Sjögren's syndrome but not in sialolithiasis. These findings suggest the potential utility of CT radiomics in evaluating salivary gland function, particularly in Sjögren's syndrome, providing insights into functional assessments without SPECT/CT.</p>","PeriodicalId":94174,"journal":{"name":"Polish journal of radiology","volume":"90 ","pages":"e253-e259"},"PeriodicalIF":0.0000,"publicationDate":"2025-05-23","publicationTypes":"Journal Article","fieldsOfStudy":null,"isOpenAccess":false,"openAccessPdf":"https://www.ncbi.nlm.nih.gov/pmc/articles/PMC12232401/pdf/","citationCount":"0","resultStr":null,"platform":"Semanticscholar","paperid":null,"PeriodicalName":"Polish journal of radiology","FirstCategoryId":"1085","ListUrlMain":"https://doi.org/10.5114/pjr/202590","RegionNum":0,"RegionCategory":null,"ArticlePicture":[],"TitleCN":null,"AbstractTextCN":null,"PMCID":null,"EPubDate":"2025/1/1 0:00:00","PubModel":"eCollection","JCR":"","JCRName":"","Score":null,"Total":0}
引用次数: 0
Abstract
Purpose: This study aimed to investigate the relationship between radiomic features extracted from computed tomography (CT) images and the mean standardised uptake value (SUVmean) obtained from salivary gland single-photon emission computed tomography (SPECT/CT), focusing on differences between Sjögren's syndrome and submandibular sialolithiasis.
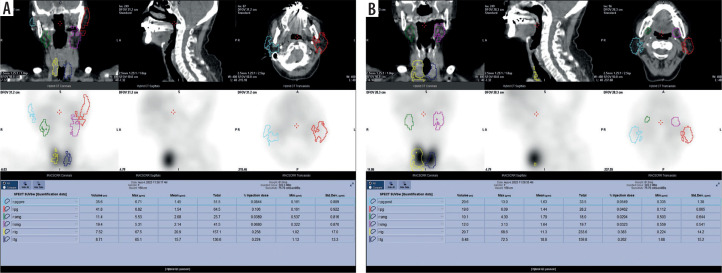
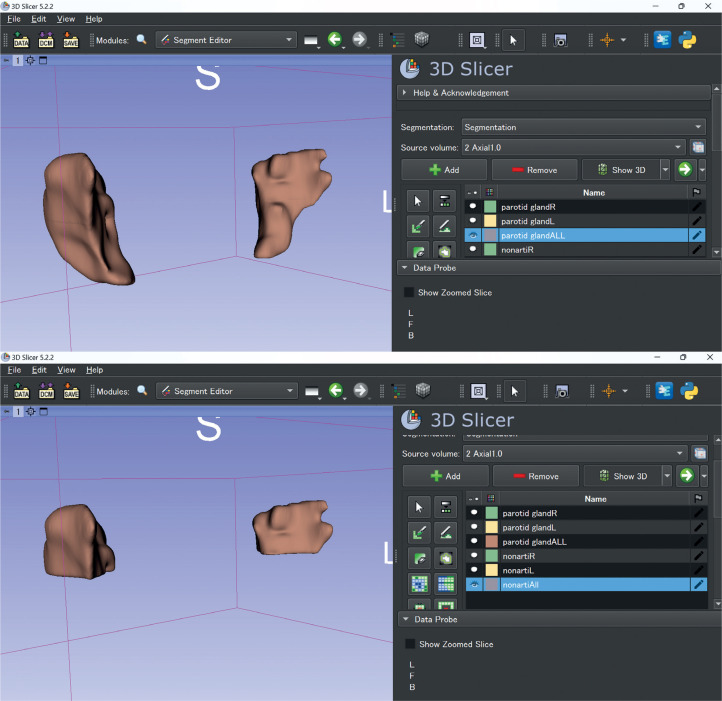
Material and methods: Thirteen patients (7 with Sjögren's syndrome and 6 with submandibular sialolithiasis) underwent CT and SPECT/CT imaging. SUVmean was calculated pre- and post-stimulation using technetium-99 m. Radiomic features were extracted from CT images using PyRadiomics, excluding shape-related features due to the impact of metal artifacts. Spearman's correlation coefficients were used to evaluate the relationship between pre/poststimulation SUVmean ratios and radiomic features. Regression models were created for features strongly correlated with SUVmean ratios.
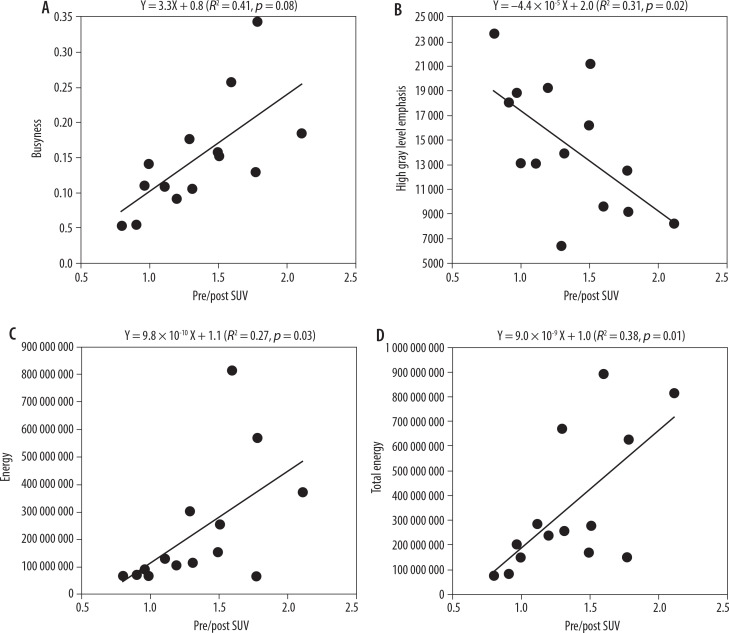
Results: The median pre/post SUVmean ratios were 1.30 (1.02-1.57) for Sjögren's syndrome and 2.35 (2.23-3.01) for sialolithiasis. In Sjögren's syndrome, 4 radiomic features correlated strongly with the SUVmean ratio: busyness (r = 0.78, p < 0.01), energy (r = 0.70, p < 0.01), total energy (r = 0.66, p = 0.01), and high grey level emphasis (r = -0.60, p = 0.02). No significant correlations were observed in sialolithiasis.
Conclusions: Specific radiomic features in CT images showed strong correlations with SUV ratios in Sjögren's syndrome but not in sialolithiasis. These findings suggest the potential utility of CT radiomics in evaluating salivary gland function, particularly in Sjögren's syndrome, providing insights into functional assessments without SPECT/CT.

 求助内容:
求助内容: 应助结果提醒方式:


