Johannes Zauner, Carolina Guidolin, Manuel Spitschan
{"title":"How to Deal With Darkness: Modeling and Visualization of Zero-Inflated Personal Light Exposure Data on a Logarithmic Scale.","authors":"Johannes Zauner, Carolina Guidolin, Manuel Spitschan","doi":"10.1177/07487304251336624","DOIUrl":null,"url":null,"abstract":"<p><p>Measuring and analyzing personal light exposure has become increasingly important in circadian and myopia research. Very small measurement values in light exposure patterns, especially zero, are regularly recorded in field studies. These zero-lux values are problematic for commonly applied logarithmic transformations and should neither be dismissed nor be unduly influential in visualizations and statistical modeling. We compare 4 ways to visualize such data on a linear, logarithmic, hybrid, or symlog scale, and we model the light exposure patterns with a generalized additive model by removing zero-lux values, adding a very small or -1 log<sub>10</sub> lux value to the dataset, or using the Tweedie error distribution. We show that a <i>symlog</i>-transformed visualization, implemented in <i>LightLogR</i>, displays relevant features of light exposure across scales, including zero-lux, while reducing the emphasis on the small values (<1 lux). <i>Symlog</i> is well-suited to visualize differences in light exposure covering heavy-tailed negative values. We further show that small but not negligible value additions to the light exposure data of -1 log<sub>10</sub> lux for statistical modeling allow for acceptable models on a logarithmic scale, while very small values distort results. We also demonstrate the utility of the Tweedie distribution, which does not require prior transformations, models data on a logarithmic scale, and includes zero-lux values, capturing personal light exposure patterns satisfactorily. Data from field studies of personal light exposure require appropriate handling of zero-lux values in a logarithmic context. <i>Symlog</i> scales for visualizations and an appropriate addition to input values for modeling, or the Tweedie distribution, provide a solid basis. Beyond light exposure, other time-series data relevant to biological rhythms, such as accelerometry for ambulatory sleep scoring in humans or wheel-running in animal models, exhibit zero inflation and can benefit from the methods introduced here.</p>","PeriodicalId":15056,"journal":{"name":"Journal of Biological Rhythms","volume":" ","pages":"480-490"},"PeriodicalIF":2.1000,"publicationDate":"2025-10-01","publicationTypes":"Journal Article","fieldsOfStudy":null,"isOpenAccess":false,"openAccessPdf":"https://www.ncbi.nlm.nih.gov/pmc/articles/PMC12426318/pdf/","citationCount":"0","resultStr":null,"platform":"Semanticscholar","paperid":null,"PeriodicalName":"Journal of Biological Rhythms","FirstCategoryId":"99","ListUrlMain":"https://doi.org/10.1177/07487304251336624","RegionNum":3,"RegionCategory":"生物学","ArticlePicture":[],"TitleCN":null,"AbstractTextCN":null,"PMCID":null,"EPubDate":"2025/6/28 0:00:00","PubModel":"Epub","JCR":"Q2","JCRName":"BIOLOGY","Score":null,"Total":0}
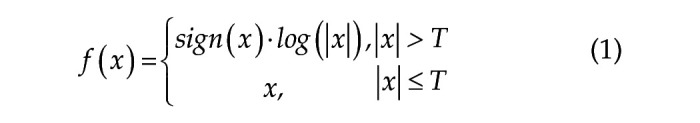
引用次数: 0
Abstract
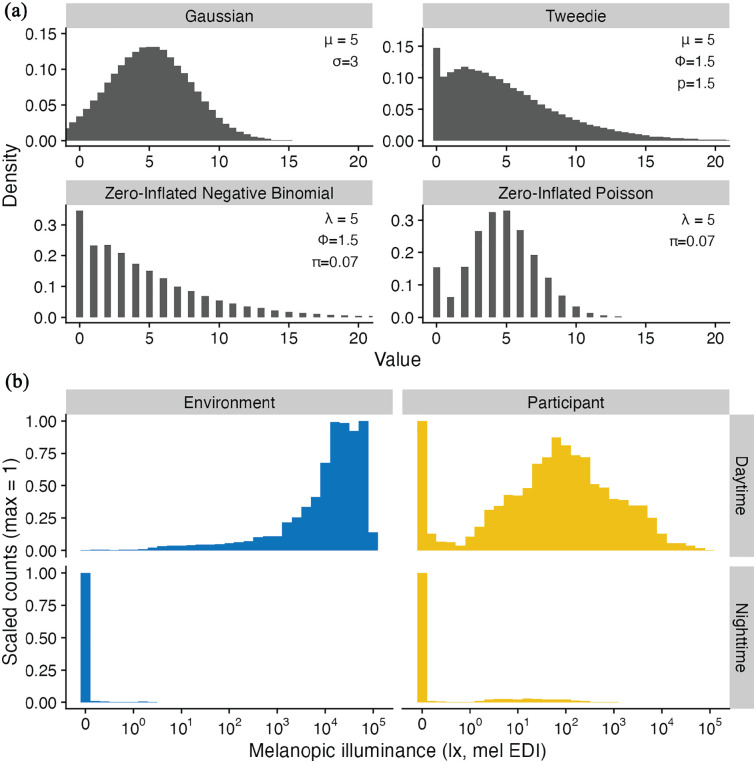
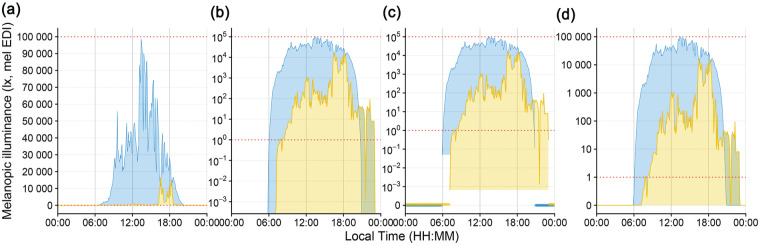
Measuring and analyzing personal light exposure has become increasingly important in circadian and myopia research. Very small measurement values in light exposure patterns, especially zero, are regularly recorded in field studies. These zero-lux values are problematic for commonly applied logarithmic transformations and should neither be dismissed nor be unduly influential in visualizations and statistical modeling. We compare 4 ways to visualize such data on a linear, logarithmic, hybrid, or symlog scale, and we model the light exposure patterns with a generalized additive model by removing zero-lux values, adding a very small or -1 log10 lux value to the dataset, or using the Tweedie error distribution. We show that a symlog-transformed visualization, implemented in LightLogR, displays relevant features of light exposure across scales, including zero-lux, while reducing the emphasis on the small values (<1 lux). Symlog is well-suited to visualize differences in light exposure covering heavy-tailed negative values. We further show that small but not negligible value additions to the light exposure data of -1 log10 lux for statistical modeling allow for acceptable models on a logarithmic scale, while very small values distort results. We also demonstrate the utility of the Tweedie distribution, which does not require prior transformations, models data on a logarithmic scale, and includes zero-lux values, capturing personal light exposure patterns satisfactorily. Data from field studies of personal light exposure require appropriate handling of zero-lux values in a logarithmic context. Symlog scales for visualizations and an appropriate addition to input values for modeling, or the Tweedie distribution, provide a solid basis. Beyond light exposure, other time-series data relevant to biological rhythms, such as accelerometry for ambulatory sleep scoring in humans or wheel-running in animal models, exhibit zero inflation and can benefit from the methods introduced here.
期刊介绍:
Journal of Biological Rhythms is the official journal of the Society for Research on Biological Rhythms and offers peer-reviewed original research in all aspects of biological rhythms, using genetic, biochemical, physiological, behavioral, epidemiological & modeling approaches, as well as clinical trials. Emphasis is on circadian and seasonal rhythms, but timely reviews and research on other periodicities are also considered. The journal is a member of the Committee on Publication Ethics (COPE).
 求助内容:
求助内容: 应助结果提醒方式:


