One-Week Postoperative Valvuloarterial Impedance as a Predictor of Left Ventricular Hypertrophy Regression 1 Year After Surgical Aortic Valve Replacement in Patients With Aortic Stenosis.
{"title":"One-Week Postoperative Valvuloarterial Impedance as a Predictor of Left Ventricular Hypertrophy Regression 1 Year After Surgical Aortic Valve Replacement in Patients With Aortic Stenosis.","authors":"Hirotaka Waki, Kenji Harada, Yusuke Suzuki, Yutaka Aoyama, Masafumi Sato, Sumika Wachi, Yusuke Ishiyama, Yukiyo Ogata, Koji Kawahito, Kazuomi Kario","doi":"10.1253/circrep.CR-24-0158","DOIUrl":null,"url":null,"abstract":"<p><strong>Background: </strong>Persistent left ventricular hypertrophy (LVH) after surgical aortic valve replacement (SAVR) for aortic stenosis (AS) worsens prognosis. We investigated predictors of LVH regression 1 year after SAVR in AS patients, including patient-prosthesis mismatch (PPM) and valvuloarterial impedance (Zva).</p><p><strong>Methods and results: </strong>We retrospectively studied 175 patients who underwent SAVR for AS at Jichi Medical University between 2014 and 2019. Echocardiography was performed at preoperative baseline, 1-week postoperative, and 1-year postoperative. The left ventricular mass index (LVMI) regression rate (RR) was defined as the difference between baseline LVMI and 1-year LVMI divided by baseline LVMI. Patients were divided into 2 groups based on their median LVMI RR as follows: (1) a poor LVH regression (PR-LVH) group with values below the median LVMI RR; and (2) a good LVH regression (GR-LVH) group with values above the median LVMI RR. The median LVMI RR was 25.4%. There were 88 (50.3%) patients in the PR-LVH group. In the multivariable analysis, 1-week postoperative Zva (odds ratio [OR] 2.777; 95% confidence interval [CI] 1.584-4.869; P<0.001) and baseline LVMI per 10-unit increment (OR 0.974; 95% CI 0.960-0.988; P=0.001) were independent predictors of PR-LVH. The receiver operating characteristic curve analysis identified Zva ≥3.5 mmHg/mL/m<sup>2</sup> as a cut-off value associated with PR-LVH.</p><p><strong>Conclusions: </strong>One-week postoperative Zva was a better predictor of improved LVH at 1 year after SAVR than PPM.</p>","PeriodicalId":94305,"journal":{"name":"Circulation reports","volume":"7 6","pages":"473-480"},"PeriodicalIF":1.1000,"publicationDate":"2025-04-11","publicationTypes":"Journal Article","fieldsOfStudy":null,"isOpenAccess":false,"openAccessPdf":"https://www.ncbi.nlm.nih.gov/pmc/articles/PMC12148358/pdf/","citationCount":"0","resultStr":null,"platform":"Semanticscholar","paperid":null,"PeriodicalName":"Circulation reports","FirstCategoryId":"1085","ListUrlMain":"https://doi.org/10.1253/circrep.CR-24-0158","RegionNum":0,"RegionCategory":null,"ArticlePicture":[],"TitleCN":null,"AbstractTextCN":null,"PMCID":null,"EPubDate":"2025/6/10 0:00:00","PubModel":"eCollection","JCR":"","JCRName":"","Score":null,"Total":0}
引用次数: 0
Abstract
Background: Persistent left ventricular hypertrophy (LVH) after surgical aortic valve replacement (SAVR) for aortic stenosis (AS) worsens prognosis. We investigated predictors of LVH regression 1 year after SAVR in AS patients, including patient-prosthesis mismatch (PPM) and valvuloarterial impedance (Zva).
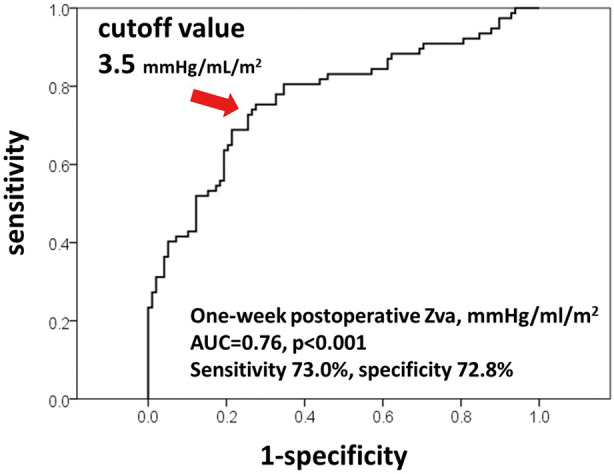
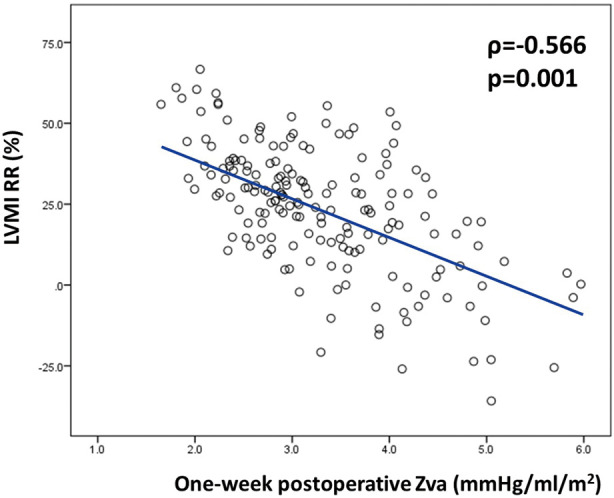
Methods and results: We retrospectively studied 175 patients who underwent SAVR for AS at Jichi Medical University between 2014 and 2019. Echocardiography was performed at preoperative baseline, 1-week postoperative, and 1-year postoperative. The left ventricular mass index (LVMI) regression rate (RR) was defined as the difference between baseline LVMI and 1-year LVMI divided by baseline LVMI. Patients were divided into 2 groups based on their median LVMI RR as follows: (1) a poor LVH regression (PR-LVH) group with values below the median LVMI RR; and (2) a good LVH regression (GR-LVH) group with values above the median LVMI RR. The median LVMI RR was 25.4%. There were 88 (50.3%) patients in the PR-LVH group. In the multivariable analysis, 1-week postoperative Zva (odds ratio [OR] 2.777; 95% confidence interval [CI] 1.584-4.869; P<0.001) and baseline LVMI per 10-unit increment (OR 0.974; 95% CI 0.960-0.988; P=0.001) were independent predictors of PR-LVH. The receiver operating characteristic curve analysis identified Zva ≥3.5 mmHg/mL/m2 as a cut-off value associated with PR-LVH.
Conclusions: One-week postoperative Zva was a better predictor of improved LVH at 1 year after SAVR than PPM.

 求助内容:
求助内容: 应助结果提醒方式:


