Ahmed Hassan Ali, Michelle Flood, Ciara Kirke, Molly Mattsson, Mary E Walsh, Emma Wallace, Derek Corrigan, Tom Fahey, Fiona Boland, Frank Moriarty
{"title":"RxTrends: An R-based Shiny Application for Visualising Open Data on Prescribed Medications in Ireland.","authors":"Ahmed Hassan Ali, Michelle Flood, Ciara Kirke, Molly Mattsson, Mary E Walsh, Emma Wallace, Derek Corrigan, Tom Fahey, Fiona Boland, Frank Moriarty","doi":"10.12688/hrbopenres.14080.2","DOIUrl":null,"url":null,"abstract":"<p><strong>Background: </strong>The Health Service Executive (HSE) in Ireland releases monthly reports on prescription dispensing claims and payments relating to community drug schemes. This paper describes the implementation of an R-based Shiny application that facilitates interactive visualisation and analysis of trends in medication prescribing and improves the data's practical value, and presents use cases focused on drug utilisation and medication policy questions.</p><p><strong>Methods: </strong>Using Primary Care Reimbursement Service (PCRS) data provided by the HSE relating to the means-tested General Medical Services (GMS) scheme covering approximately one-third of the population, an R-based Shiny application was developed. This application uses monthly prescribing and cost data from 2016 up to the most recent data available (currently October 2024) relating to the 100 most commonly prescribed medications (by frequency and cost) and all therapeutic groups. The application leverages a range of R packages to enable users to select medications, therapeutic groups, and physiological systems to explore and compare prescribing and cost trends over time.</p><p><strong>Results: </strong>The RxTrends Shiny application effectively integrates PCRS data, providing multiple functionalities that allow for visualisation of dispensing trends of multiple medications, therapeutic groups and physiological systems. Graphs are available across multiple prescribing frequency and cost metrics and can be restricted to a selected time period. The 'compare' function visualises the proportion of prescribing/cost a selected medication or therapeutic group accounts for within a therapeutic group or physiological system. Use cases relating to Ireland's Preferred Drug Initiative, availability of generic products and reference pricing, and seasonality of drug utilisation are presented.</p><p><strong>Conclusion: </strong>The application provides an interactive interface for stakeholders to visualise and monitor prescribing patterns using data from monthly PCRS reports. The application increases access to and usability of PCRS data for various audiences for whom it may be of interest, including researchers, healthcare professionals, policymakers and the general public.</p>","PeriodicalId":73254,"journal":{"name":"HRB open research","volume":"8 ","pages":"36"},"PeriodicalIF":0.0000,"publicationDate":"2025-05-27","publicationTypes":"Journal Article","fieldsOfStudy":null,"isOpenAccess":false,"openAccessPdf":"https://www.ncbi.nlm.nih.gov/pmc/articles/PMC12130776/pdf/","citationCount":"0","resultStr":null,"platform":"Semanticscholar","paperid":null,"PeriodicalName":"HRB open research","FirstCategoryId":"1085","ListUrlMain":"https://doi.org/10.12688/hrbopenres.14080.2","RegionNum":0,"RegionCategory":null,"ArticlePicture":[],"TitleCN":null,"AbstractTextCN":null,"PMCID":null,"EPubDate":"2025/1/1 0:00:00","PubModel":"eCollection","JCR":"","JCRName":"","Score":null,"Total":0}
引用次数: 0
Abstract
Background: The Health Service Executive (HSE) in Ireland releases monthly reports on prescription dispensing claims and payments relating to community drug schemes. This paper describes the implementation of an R-based Shiny application that facilitates interactive visualisation and analysis of trends in medication prescribing and improves the data's practical value, and presents use cases focused on drug utilisation and medication policy questions.
Methods: Using Primary Care Reimbursement Service (PCRS) data provided by the HSE relating to the means-tested General Medical Services (GMS) scheme covering approximately one-third of the population, an R-based Shiny application was developed. This application uses monthly prescribing and cost data from 2016 up to the most recent data available (currently October 2024) relating to the 100 most commonly prescribed medications (by frequency and cost) and all therapeutic groups. The application leverages a range of R packages to enable users to select medications, therapeutic groups, and physiological systems to explore and compare prescribing and cost trends over time.
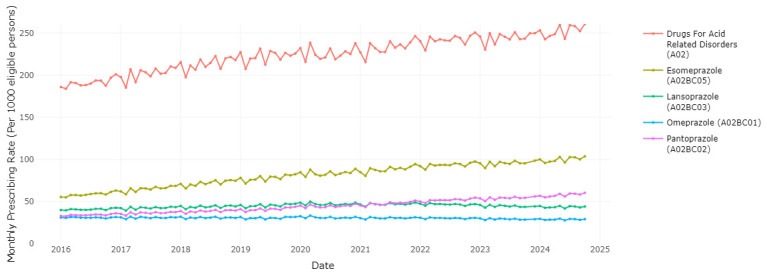
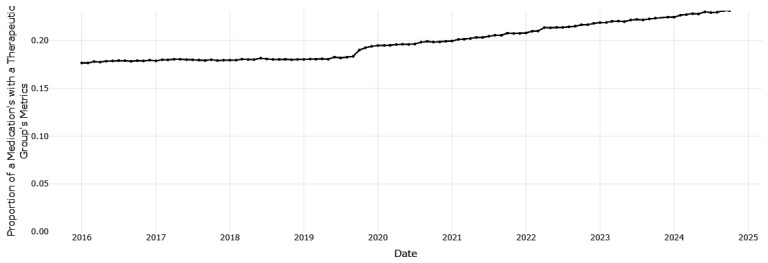
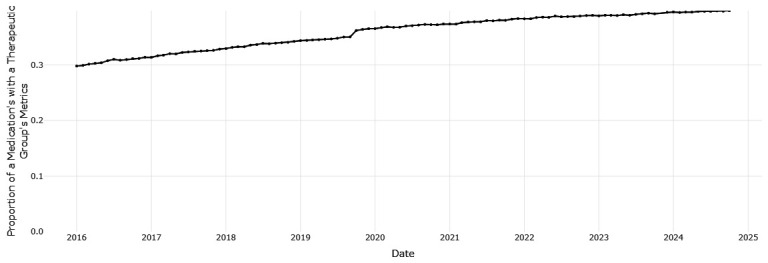
Results: The RxTrends Shiny application effectively integrates PCRS data, providing multiple functionalities that allow for visualisation of dispensing trends of multiple medications, therapeutic groups and physiological systems. Graphs are available across multiple prescribing frequency and cost metrics and can be restricted to a selected time period. The 'compare' function visualises the proportion of prescribing/cost a selected medication or therapeutic group accounts for within a therapeutic group or physiological system. Use cases relating to Ireland's Preferred Drug Initiative, availability of generic products and reference pricing, and seasonality of drug utilisation are presented.
Conclusion: The application provides an interactive interface for stakeholders to visualise and monitor prescribing patterns using data from monthly PCRS reports. The application increases access to and usability of PCRS data for various audiences for whom it may be of interest, including researchers, healthcare professionals, policymakers and the general public.

 求助内容:
求助内容: 应助结果提醒方式:


