Wave height fluctuations in the waveforms of an endoscopic pressure study integrated system have the potential to predict acid reflux in gastroesophageal reflux disease (with video)
{"title":"Wave height fluctuations in the waveforms of an endoscopic pressure study integrated system have the potential to predict acid reflux in gastroesophageal reflux disease (with video)","authors":"Satoshi Abiko, Yuto Shimamura, Haruhiro Inoue, Masachika Saino, Kei Ushikubo, Miyuki Iwasaki, Kazuki Yamamoto, Yohei Nishikawa, Ippei Tanaka, Hidenori Tanaka, Mayo Tanabe, Boldbaatar Gantuya, Manabu Onimaru, Naoya Sakamoto","doi":"10.1111/den.15049","DOIUrl":null,"url":null,"abstract":"<div>\n \n <section>\n \n <h3> Objectives</h3>\n \n <p>The endoscopic pressure study integrated system (EPSIS) is a useful diagnostic tool for gastroesophageal reflux disease (GERD). Although wave height fluctuations have been observed in EPSIS waveforms, their clinical significance remains unclear. We hypothesized that the magnitude of these fluctuations may reflect lower esophageal sphincter functionality. This study aimed to evaluate the association between wave height fluctuations and objective acid reflux parameters.</p>\n </section>\n \n <section>\n \n <h3> Methods</h3>\n \n <p>A retrospective analysis was conducted on patients with GERD symptoms who underwent both EPSIS and 24-h multichannel intraluminal impedance-pH monitoring at a single tertiary center between June 2020 and December 2023. Abnormal acid reflux was defined as an acid exposure time (AET) ≥6.0%. Wave height was defined as the difference in intragastric pressure between the crest and trough of the EPSIS waveform. A diagnostic cut-off value for wave height was determined, and factors associated with elevated wave height were analyzed.</p>\n </section>\n \n <section>\n \n <h3> Results</h3>\n \n <p>A total of 129 patients were included, of whom 29 (22.5%) had abnormal acid reflux. The median wave height was 2.5 mmHg. Patients with AET ≥6% had significantly higher wave heights than those with AET <6% (<i>P</i> = 0.0141). A wave height of 3.1 mmHg demonstrated optimal diagnostic performance for predicting abnormal AET. Multivariate analysis revealed that abnormal AET (odds ratio 3.43, 95% confidence interval 1.39–8.44, <i>P</i> = 0.0074) was independently associated with wave heights ≥3.1 mmHg.</p>\n </section>\n \n <section>\n \n <h3> Conclusions</h3>\n \n <p>Wave height fluctuations in EPSIS waveforms may reflect lower esophageal sphincter dysfunction and serve as a novel predictor of pathological acid reflux in patients with GERD.</p>\n </section>\n </div>","PeriodicalId":159,"journal":{"name":"Digestive Endoscopy","volume":"37 9","pages":"981-988"},"PeriodicalIF":4.7000,"publicationDate":"2025-05-30","publicationTypes":"Journal Article","fieldsOfStudy":null,"isOpenAccess":false,"openAccessPdf":"","citationCount":"0","resultStr":null,"platform":"Semanticscholar","paperid":null,"PeriodicalName":"Digestive Endoscopy","FirstCategoryId":"3","ListUrlMain":"https://onlinelibrary.wiley.com/doi/10.1111/den.15049","RegionNum":2,"RegionCategory":"医学","ArticlePicture":[],"TitleCN":null,"AbstractTextCN":null,"PMCID":null,"EPubDate":"","PubModel":"","JCR":"Q1","JCRName":"GASTROENTEROLOGY & HEPATOLOGY","Score":null,"Total":0}
引用次数: 0
Abstract
Objectives
The endoscopic pressure study integrated system (EPSIS) is a useful diagnostic tool for gastroesophageal reflux disease (GERD). Although wave height fluctuations have been observed in EPSIS waveforms, their clinical significance remains unclear. We hypothesized that the magnitude of these fluctuations may reflect lower esophageal sphincter functionality. This study aimed to evaluate the association between wave height fluctuations and objective acid reflux parameters.
Methods
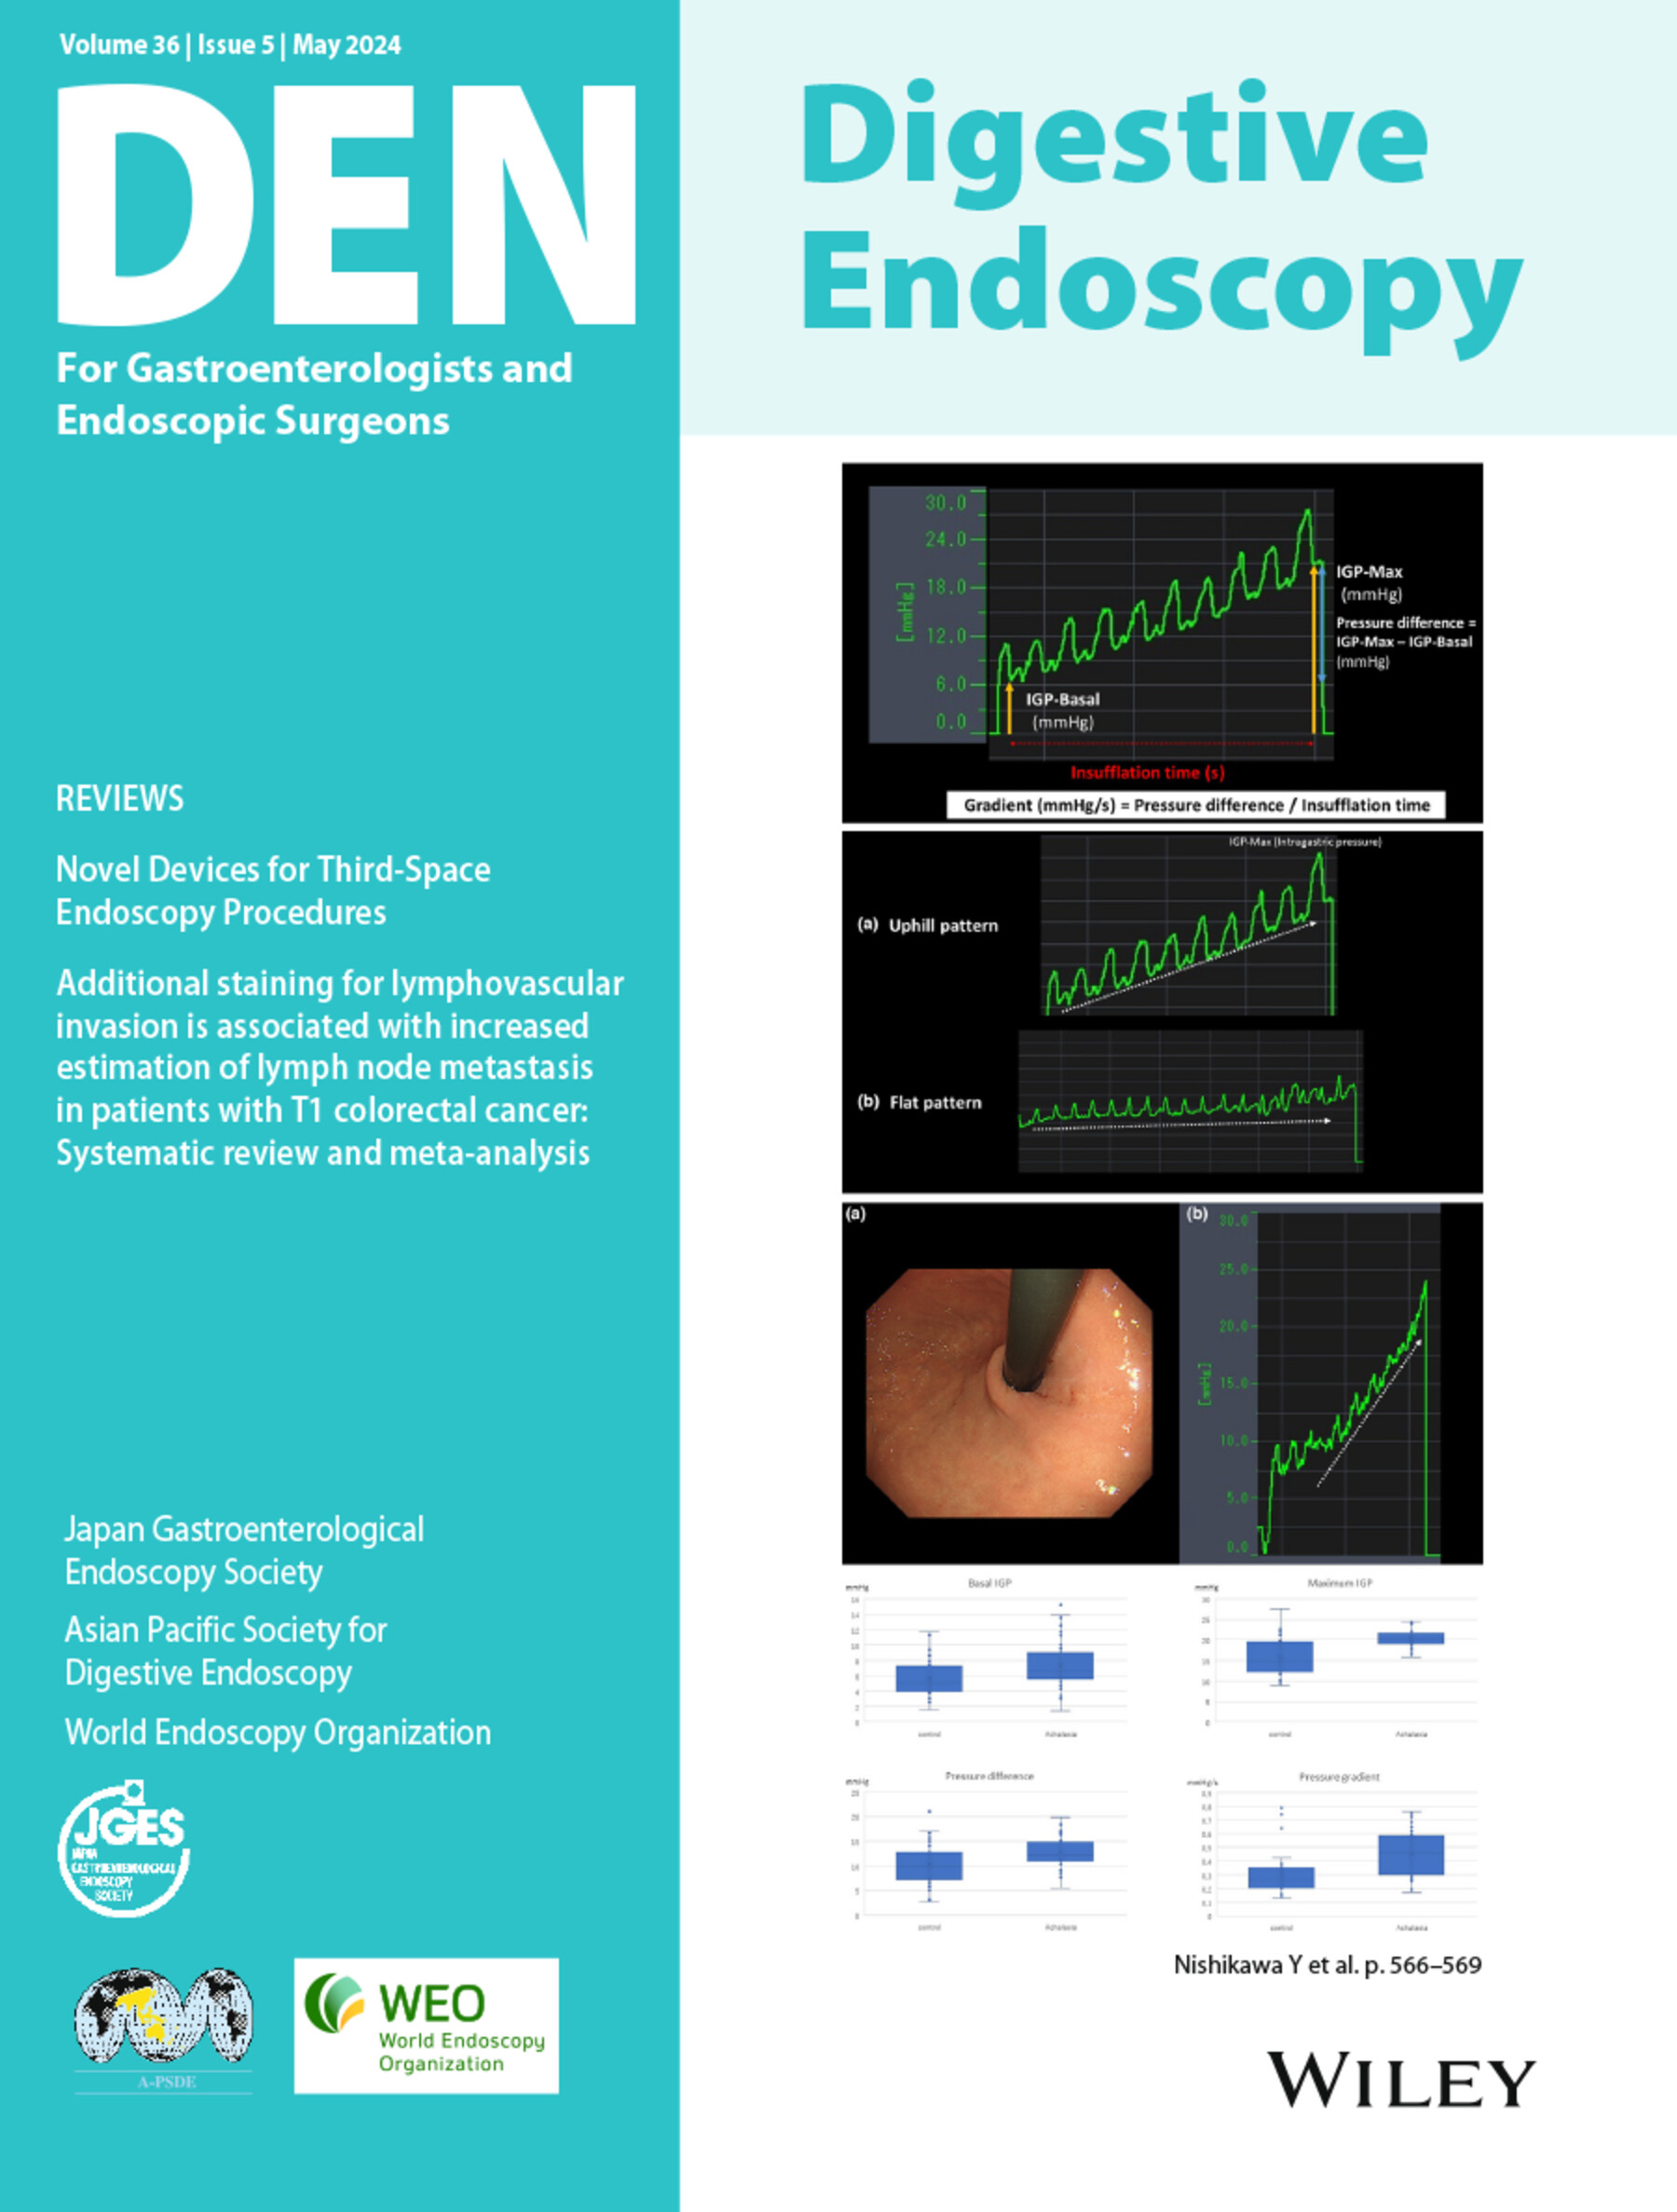
A retrospective analysis was conducted on patients with GERD symptoms who underwent both EPSIS and 24-h multichannel intraluminal impedance-pH monitoring at a single tertiary center between June 2020 and December 2023. Abnormal acid reflux was defined as an acid exposure time (AET) ≥6.0%. Wave height was defined as the difference in intragastric pressure between the crest and trough of the EPSIS waveform. A diagnostic cut-off value for wave height was determined, and factors associated with elevated wave height were analyzed.
Results
A total of 129 patients were included, of whom 29 (22.5%) had abnormal acid reflux. The median wave height was 2.5 mmHg. Patients with AET ≥6% had significantly higher wave heights than those with AET <6% (P = 0.0141). A wave height of 3.1 mmHg demonstrated optimal diagnostic performance for predicting abnormal AET. Multivariate analysis revealed that abnormal AET (odds ratio 3.43, 95% confidence interval 1.39–8.44, P = 0.0074) was independently associated with wave heights ≥3.1 mmHg.
Conclusions
Wave height fluctuations in EPSIS waveforms may reflect lower esophageal sphincter dysfunction and serve as a novel predictor of pathological acid reflux in patients with GERD.
期刊介绍:
Digestive Endoscopy (DEN) is the official journal of the Japan Gastroenterological Endoscopy Society, the Asian Pacific Society for Digestive Endoscopy and the World Endoscopy Organization. Digestive Endoscopy serves as a medium for presenting original articles that offer significant contributions to knowledge in the broad field of endoscopy. The Journal also includes Reviews, Original Articles, How I Do It, Case Reports (only of exceptional interest and novelty are accepted), Letters, Techniques and Images, abstracts and news items that may be of interest to endoscopists.
 求助内容:
求助内容: 应助结果提醒方式:


