Shravan Asthana, Daron Excel, Hemali Shah, Abhinav Talwar, Stephanie Smith
{"title":"Trends in Private Equity Owned Otolaryngology Practice Clinician Distribution.","authors":"Shravan Asthana, Daron Excel, Hemali Shah, Abhinav Talwar, Stephanie Smith","doi":"10.1002/oto2.70112","DOIUrl":null,"url":null,"abstract":"<p><strong>Objective: </strong>Investigate how private equity (PE) acquisitions shape the otolaryngology workforce.</p><p><strong>Study design: </strong>Cross-sectional.</p><p><strong>Setting: </strong>Private outpatient clinics.</p><p><strong>Methods: </strong>A comprehensive market database, Pitchbook (Seattle, WA), was queried utilizing keywords for outpatient otolaryngology practices acquired by PE firms from 2010 to 2023. Acquisitions were manually verified using practice websites. An open-source website archive service, WayBack Machine, was utilized to track workforce history of practicing otolaryngologist physicians, audiologists (AuDs), and advanced practice providers (APPs) at these outpatient practices and then subjected to linear regression and Pearson correlation test analysis.</p><p><strong>Results: </strong>In total, 25 otolaryngology practices were determined to have been acquired by PE, all between 2018 and 2023. Acquisitions predominantly occurred in 2020 (n = 8, 32%) and 2023 (n = 7, 28%) and were mostly in the South Atlantic (n = 10, 40%) or Midwest (n = 8, 32%) regions. From 2018 to 2023, total practice locations increased by 32.0% (n = 194 to n = 256), and the total clinician pool increased by 17.9% (n = 901 to n = 1007). Although physicians (n = 500 to n = 517, <i>r</i> = 0.59, <i>P</i> = .213) and AuDs (n = 229 to n = 242, <i>r</i> = 0.34, <i>P</i> = .507) increased nonlinearly, the increase in APPs was strongly linear (n = 172 to n = 248, <i>r</i> = 0.95, <i>P</i> = .003). As a proportion of the total clinician pool, there was a relative decrease in physicians (55.5%-51.3%) and AuDs (25.4%-24.0%), offset by a relative increase in APPs (19.1%-24.6%).</p><p><strong>Conclusion: </strong>Our findings indicate a disproportionate increase in APPs relative to physicians and AuDs, although without a comparison group we are unable to draw conclusions in relation to changes in the non-PE workforce as a whole.</p>","PeriodicalId":19697,"journal":{"name":"OTO Open","volume":"9 2","pages":"e70112"},"PeriodicalIF":1.8000,"publicationDate":"2025-04-11","publicationTypes":"Journal Article","fieldsOfStudy":null,"isOpenAccess":false,"openAccessPdf":"https://www.ncbi.nlm.nih.gov/pmc/articles/PMC11986684/pdf/","citationCount":"0","resultStr":null,"platform":"Semanticscholar","paperid":null,"PeriodicalName":"OTO Open","FirstCategoryId":"1085","ListUrlMain":"https://doi.org/10.1002/oto2.70112","RegionNum":0,"RegionCategory":null,"ArticlePicture":[],"TitleCN":null,"AbstractTextCN":null,"PMCID":null,"EPubDate":"2025/4/1 0:00:00","PubModel":"eCollection","JCR":"Q2","JCRName":"OTORHINOLARYNGOLOGY","Score":null,"Total":0}
引用次数: 0
Abstract
Objective: Investigate how private equity (PE) acquisitions shape the otolaryngology workforce.
Study design: Cross-sectional.
Setting: Private outpatient clinics.
Methods: A comprehensive market database, Pitchbook (Seattle, WA), was queried utilizing keywords for outpatient otolaryngology practices acquired by PE firms from 2010 to 2023. Acquisitions were manually verified using practice websites. An open-source website archive service, WayBack Machine, was utilized to track workforce history of practicing otolaryngologist physicians, audiologists (AuDs), and advanced practice providers (APPs) at these outpatient practices and then subjected to linear regression and Pearson correlation test analysis.
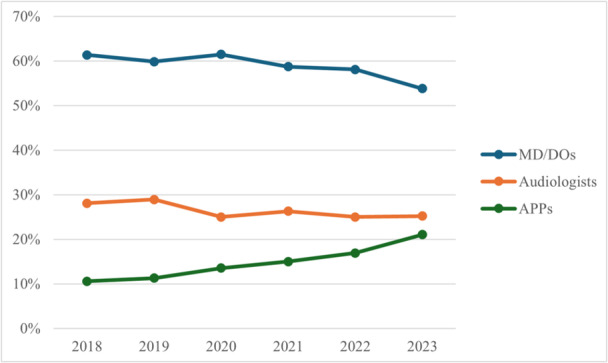
Results: In total, 25 otolaryngology practices were determined to have been acquired by PE, all between 2018 and 2023. Acquisitions predominantly occurred in 2020 (n = 8, 32%) and 2023 (n = 7, 28%) and were mostly in the South Atlantic (n = 10, 40%) or Midwest (n = 8, 32%) regions. From 2018 to 2023, total practice locations increased by 32.0% (n = 194 to n = 256), and the total clinician pool increased by 17.9% (n = 901 to n = 1007). Although physicians (n = 500 to n = 517, r = 0.59, P = .213) and AuDs (n = 229 to n = 242, r = 0.34, P = .507) increased nonlinearly, the increase in APPs was strongly linear (n = 172 to n = 248, r = 0.95, P = .003). As a proportion of the total clinician pool, there was a relative decrease in physicians (55.5%-51.3%) and AuDs (25.4%-24.0%), offset by a relative increase in APPs (19.1%-24.6%).
Conclusion: Our findings indicate a disproportionate increase in APPs relative to physicians and AuDs, although without a comparison group we are unable to draw conclusions in relation to changes in the non-PE workforce as a whole.

 求助内容:
求助内容: 应助结果提醒方式:


