Zenan Xing, James Eckhardt, Aditya S Vaidya, Sean R Cutler
{"title":"BioCurve Analyzer: a web-based shiny app for analyzing biological response curves.","authors":"Zenan Xing, James Eckhardt, Aditya S Vaidya, Sean R Cutler","doi":"10.1186/s13007-025-01372-x","DOIUrl":null,"url":null,"abstract":"<p><strong>Background: </strong>Dose-response and time-to-event data are common in enzymology, pharmacology, and agronomy studies. Diverse biological response curves can be generated from such data. The features of these curves can be elucidated through parameters such as ED<sub>50</sub> (the effective dose that gives 50% of the maximum response) and T<sub>50</sub> (the time required to reach 50% of the maximum response). Properly estimating these parameters is crucial for inferring the potency of compounds or the relative timings of biological processes.</p><p><strong>Results: </strong>We present an open-source Shiny application, BioCurve Analyzer, that simplifies the process of inferring ED<sub>50</sub> and T<sub>50</sub> parameters from response curves exhibiting various patterns, including classic monotonic sigmoidal curves and more complicated biphasic curves. BioCurve Analyzer provides access to several packages and commonly used models for characterizing response patterns, assists users in identifying the models that best describe their data, and includes options for inferring ED<sub>50</sub> values on both sides of biphasic curves. BioCurve Analyzer also facilitates the visualization of response patterns and allows users to customize their final graphical representation to deliver publication-quality graphs of the data.</p><p><strong>Conclusion: </strong>BioCurve Analyzer integrates multiple R packages in an easy-to-use web-based interface to facilitate dose-response and time-to-event analyses.</p>","PeriodicalId":20100,"journal":{"name":"Plant Methods","volume":"21 1","pages":"55"},"PeriodicalIF":4.4000,"publicationDate":"2025-04-27","publicationTypes":"Journal Article","fieldsOfStudy":null,"isOpenAccess":false,"openAccessPdf":"https://www.ncbi.nlm.nih.gov/pmc/articles/PMC12036208/pdf/","citationCount":"0","resultStr":null,"platform":"Semanticscholar","paperid":null,"PeriodicalName":"Plant Methods","FirstCategoryId":"99","ListUrlMain":"https://doi.org/10.1186/s13007-025-01372-x","RegionNum":2,"RegionCategory":"生物学","ArticlePicture":[],"TitleCN":null,"AbstractTextCN":null,"PMCID":null,"EPubDate":"","PubModel":"","JCR":"Q1","JCRName":"BIOCHEMICAL RESEARCH METHODS","Score":null,"Total":0}
引用次数: 0
Abstract
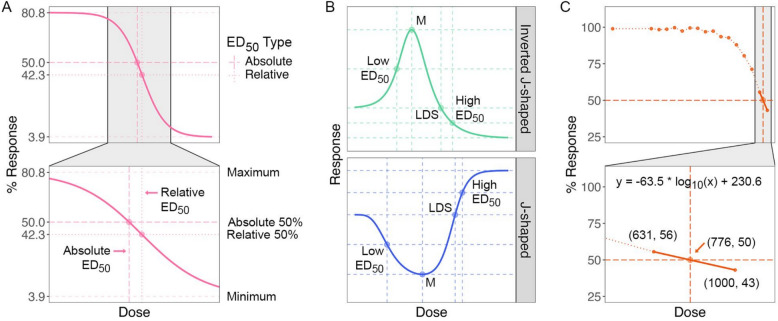
Background: Dose-response and time-to-event data are common in enzymology, pharmacology, and agronomy studies. Diverse biological response curves can be generated from such data. The features of these curves can be elucidated through parameters such as ED50 (the effective dose that gives 50% of the maximum response) and T50 (the time required to reach 50% of the maximum response). Properly estimating these parameters is crucial for inferring the potency of compounds or the relative timings of biological processes.
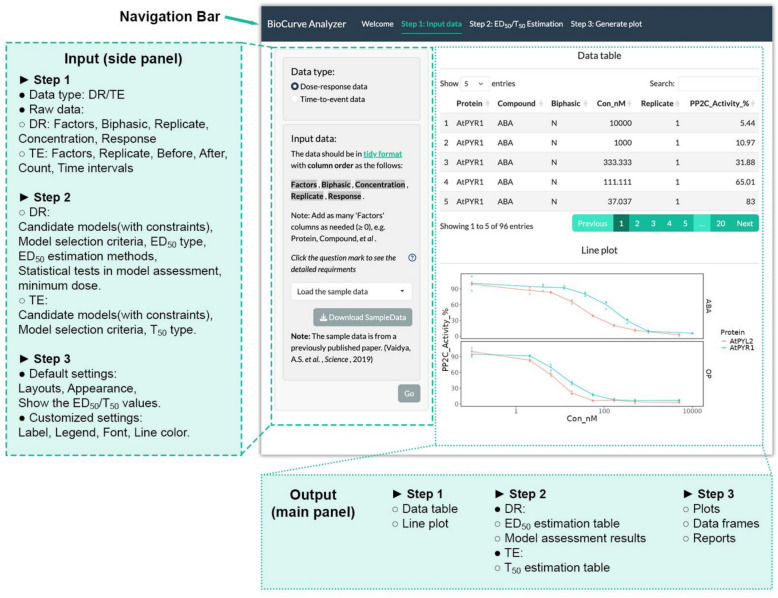
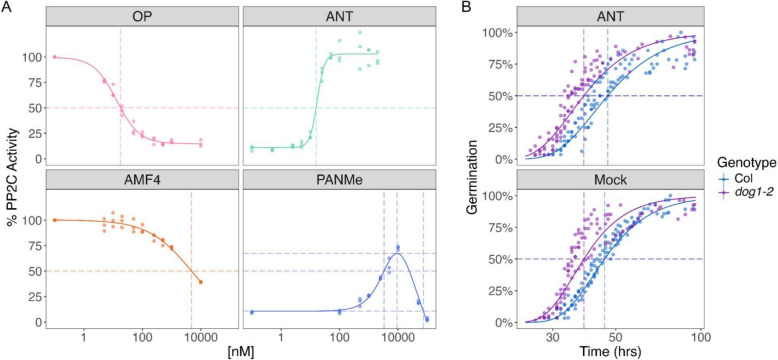
Results: We present an open-source Shiny application, BioCurve Analyzer, that simplifies the process of inferring ED50 and T50 parameters from response curves exhibiting various patterns, including classic monotonic sigmoidal curves and more complicated biphasic curves. BioCurve Analyzer provides access to several packages and commonly used models for characterizing response patterns, assists users in identifying the models that best describe their data, and includes options for inferring ED50 values on both sides of biphasic curves. BioCurve Analyzer also facilitates the visualization of response patterns and allows users to customize their final graphical representation to deliver publication-quality graphs of the data.
Conclusion: BioCurve Analyzer integrates multiple R packages in an easy-to-use web-based interface to facilitate dose-response and time-to-event analyses.
期刊介绍:
Plant Methods is an open access, peer-reviewed, online journal for the plant research community that encompasses all aspects of technological innovation in the plant sciences.
There is no doubt that we have entered an exciting new era in plant biology. The completion of the Arabidopsis genome sequence, and the rapid progress being made in other plant genomics projects are providing unparalleled opportunities for progress in all areas of plant science. Nevertheless, enormous challenges lie ahead if we are to understand the function of every gene in the genome, and how the individual parts work together to make the whole organism. Achieving these goals will require an unprecedented collaborative effort, combining high-throughput, system-wide technologies with more focused approaches that integrate traditional disciplines such as cell biology, biochemistry and molecular genetics.
Technological innovation is probably the most important catalyst for progress in any scientific discipline. Plant Methods’ goal is to stimulate the development and adoption of new and improved techniques and research tools and, where appropriate, to promote consistency of methodologies for better integration of data from different laboratories.
 求助内容:
求助内容: 应助结果提醒方式:


