Differentiation of non-ST-segment elevation myocardial infarction from unstable angina using coronary computed tomography angiography: the role of imaging features and pericoronary adipose tissue radiomics.
{"title":"Differentiation of non-ST-segment elevation myocardial infarction from unstable angina using coronary computed tomography angiography: the role of imaging features and pericoronary adipose tissue radiomics.","authors":"Yang Lu, Qing Wang, Haifeng Liu, Qi Liu, Siqi Wang, Wei Xing","doi":"10.5603/cj.98559","DOIUrl":null,"url":null,"abstract":"<p><strong>Background: </strong>To ascertain the diagnostic value of radiomic features of pericoronary adipose tissue (PCAT) and other coronary computed tomography angiography (CCTA) parameters for differentiating non-ST-segment-elevation myocardial infarction (NSTEMI) from unstable angina (UA).</p><p><strong>Methods: </strong>This study included NSTEMI and UA patients (n = 102 each). The radiomic features of PCAT were selected according to the intraclass correlation coefficient, Pearson's coefficient, the t test, and least absolute shrinkage and selection operator. Six classifiers-random forest, support vector machine, naive Bayes, K-nearest neighbors, extreme gradient boosting, and light gradient boosting machine (LightGBM)-were used to build radiomics models, and the best were selected. Four CCTA parameter models, encapsulating plaque parameters (model 1), plaque parameters + fatty attenuation index (FAI) (model 2), plaque parameters + CT fractional flow reserve (CT-FFR) (model 3), and plaque parameters + CT-FFR + FAI (model 4), were constructed. Finally, we established a fusion model (nomogram) with all CCTA parameters and radiomics model scores. All models were compared regarding their performance.</p><p><strong>Results: </strong>The LightGBM radiomics model achieved the highest AUC. Among CCTA parameter models, only model 4 achieved a predictive performance similar to that of the radiomics model in the training and test cohorts (AUC = 0.904 vs. 0.898 and 0.860 vs. 0.877). The combined model (nomogram) showed greater predictive efficacy (AUC = 0.963, 0.910) than model 4 or the radiomics model.</p><p><strong>Conclusion: </strong>The PCAT-based radiomics model accurately distinguishes between NSTEMI and UA, with similar diagnostic performance as the model that combined all the significant CCTA parameters. The nomogram integrating CCTA parameters and the radiomic score has good clinical application prospects.</p>","PeriodicalId":93923,"journal":{"name":"Cardiology journal","volume":" ","pages":"291-300"},"PeriodicalIF":0.0000,"publicationDate":"2025-01-01","publicationTypes":"Journal Article","fieldsOfStudy":null,"isOpenAccess":false,"openAccessPdf":"https://www.ncbi.nlm.nih.gov/pmc/articles/PMC12221326/pdf/","citationCount":"0","resultStr":null,"platform":"Semanticscholar","paperid":null,"PeriodicalName":"Cardiology journal","FirstCategoryId":"1085","ListUrlMain":"https://doi.org/10.5603/cj.98559","RegionNum":0,"RegionCategory":null,"ArticlePicture":[],"TitleCN":null,"AbstractTextCN":null,"PMCID":null,"EPubDate":"2025/5/13 0:00:00","PubModel":"Epub","JCR":"","JCRName":"","Score":null,"Total":0}
引用次数: 0
Abstract
Background: To ascertain the diagnostic value of radiomic features of pericoronary adipose tissue (PCAT) and other coronary computed tomography angiography (CCTA) parameters for differentiating non-ST-segment-elevation myocardial infarction (NSTEMI) from unstable angina (UA).
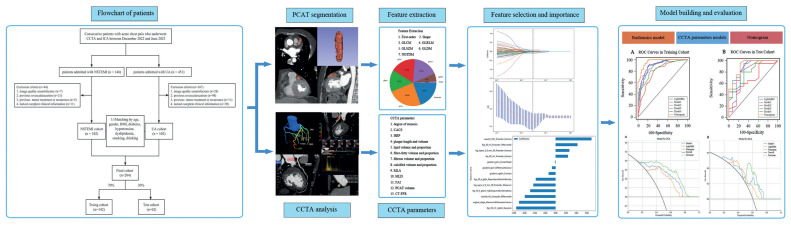
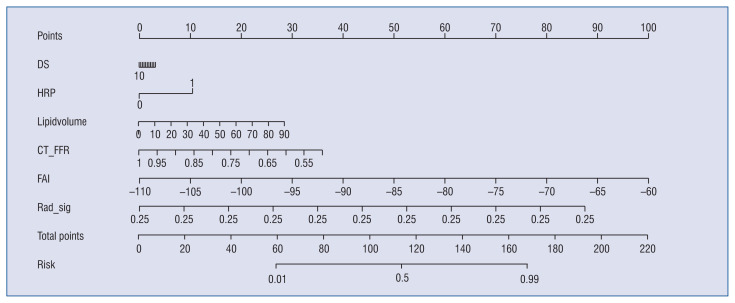
Methods: This study included NSTEMI and UA patients (n = 102 each). The radiomic features of PCAT were selected according to the intraclass correlation coefficient, Pearson's coefficient, the t test, and least absolute shrinkage and selection operator. Six classifiers-random forest, support vector machine, naive Bayes, K-nearest neighbors, extreme gradient boosting, and light gradient boosting machine (LightGBM)-were used to build radiomics models, and the best were selected. Four CCTA parameter models, encapsulating plaque parameters (model 1), plaque parameters + fatty attenuation index (FAI) (model 2), plaque parameters + CT fractional flow reserve (CT-FFR) (model 3), and plaque parameters + CT-FFR + FAI (model 4), were constructed. Finally, we established a fusion model (nomogram) with all CCTA parameters and radiomics model scores. All models were compared regarding their performance.
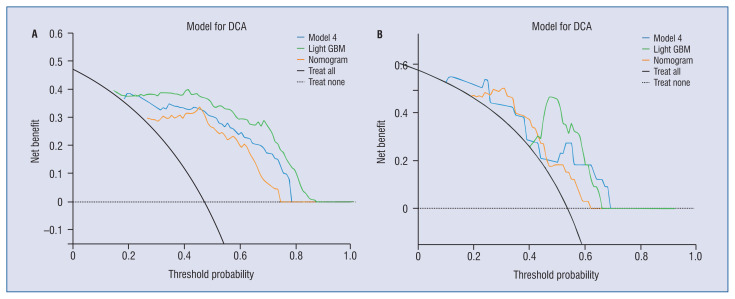
Results: The LightGBM radiomics model achieved the highest AUC. Among CCTA parameter models, only model 4 achieved a predictive performance similar to that of the radiomics model in the training and test cohorts (AUC = 0.904 vs. 0.898 and 0.860 vs. 0.877). The combined model (nomogram) showed greater predictive efficacy (AUC = 0.963, 0.910) than model 4 or the radiomics model.
Conclusion: The PCAT-based radiomics model accurately distinguishes between NSTEMI and UA, with similar diagnostic performance as the model that combined all the significant CCTA parameters. The nomogram integrating CCTA parameters and the radiomic score has good clinical application prospects.

 求助内容:
求助内容: 应助结果提醒方式:


