{"title":"Use of Electron Density Maps and Fused Images in Dual-Energy Cardiac Computed Tomography to Facilitate Detection of Late Iodine Enhancement.","authors":"Junji Mochizuki, Yoshiki Hata, Takeshi Nakaura, Yasunori Nagayama, Masafumi Kidoh, Hiroyuki Uetani, Kaori Shiraishi, Naoki Kobayashi, Yoshinori Funama, Toshinori Hirai","doi":"10.1253/circrep.CR-24-0115","DOIUrl":null,"url":null,"abstract":"<p><strong>Background: </strong>This study aimed to optimize the fusion of quantitative maps and morphological images to improve late iodine enhancement (LIE) imaging using cardiac dual-energy computed tomography (DECT).</p><p><strong>Methods and results: </strong>We retrospectively analyzed 15 patients with suspected old myocardial infarction who underwent cardiac DECT. Virtual monochromatic images (VMI) ranging from 40 to 200 keV and quantitative maps (e.g., iodine concentration, effective atomic number, and electron density [(%EDW: percentage relative to the electron density of water)] were generated. The contrast-to-noise ratio (CNR) between LIE areas and the left ventricular (LV) blood pool and normal myocardium was calculated to determine the optimal image fusion for LIE delineation. VMI at 40 keV demonstrated superior CNR between LIE areas and normal myocardium. Electron density was significantly higher in LIE areas [105.5%EDW (interquartile range (IQR): 105.15-105.65)] than in the LV blood pool [104.4%EDW (IQR: 104.3-104.6)] and normal myocardium [104.4%EDW (IQR: 104.2-104.65)] (P<0.001). Iodine concentration and effective atomic number differed significantly between LIE areas and normal myocardium, but did not differ significantly between LIE areas and the LV blood pool. Fusion of 40 keV VMI with electron density maps yielded the highest area under the receiver operating characteristic curve (0.917).</p><p><strong>Conclusions: </strong>Fused images combining 40 keV VMI with electron density maps significantly enhanced the visualization of LIE areas on DECT, offering improved contrast and diagnostic accuracy for the assessment of myocardial territories.</p>","PeriodicalId":94305,"journal":{"name":"Circulation reports","volume":"7 5","pages":"341-349"},"PeriodicalIF":1.1000,"publicationDate":"2025-04-11","publicationTypes":"Journal Article","fieldsOfStudy":null,"isOpenAccess":false,"openAccessPdf":"https://www.ncbi.nlm.nih.gov/pmc/articles/PMC12061510/pdf/","citationCount":"0","resultStr":null,"platform":"Semanticscholar","paperid":null,"PeriodicalName":"Circulation reports","FirstCategoryId":"1085","ListUrlMain":"https://doi.org/10.1253/circrep.CR-24-0115","RegionNum":0,"RegionCategory":null,"ArticlePicture":[],"TitleCN":null,"AbstractTextCN":null,"PMCID":null,"EPubDate":"2025/5/9 0:00:00","PubModel":"eCollection","JCR":"","JCRName":"","Score":null,"Total":0}
引用次数: 0
Abstract
Background: This study aimed to optimize the fusion of quantitative maps and morphological images to improve late iodine enhancement (LIE) imaging using cardiac dual-energy computed tomography (DECT).
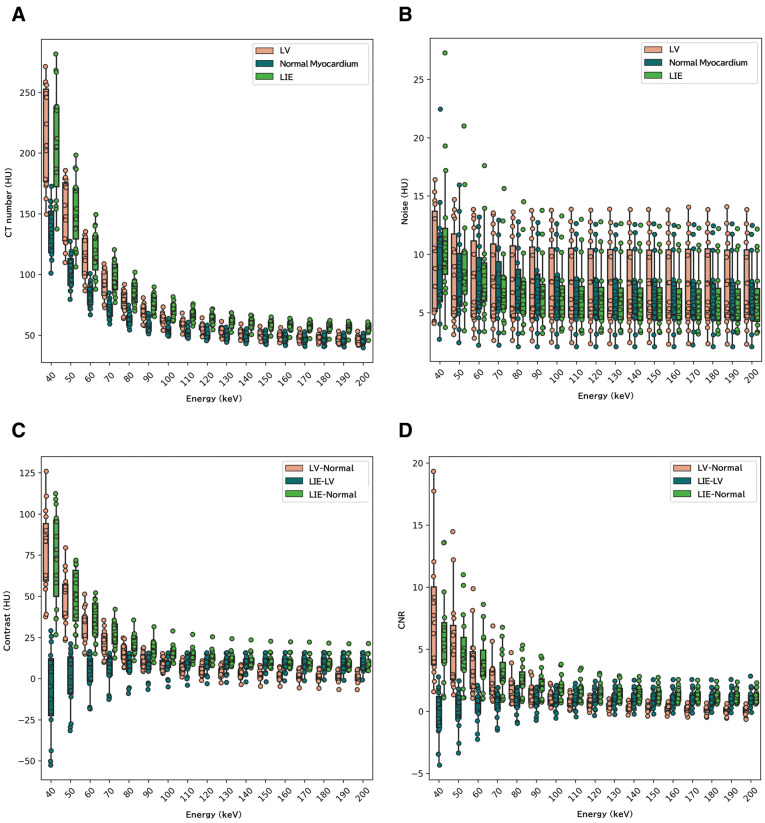
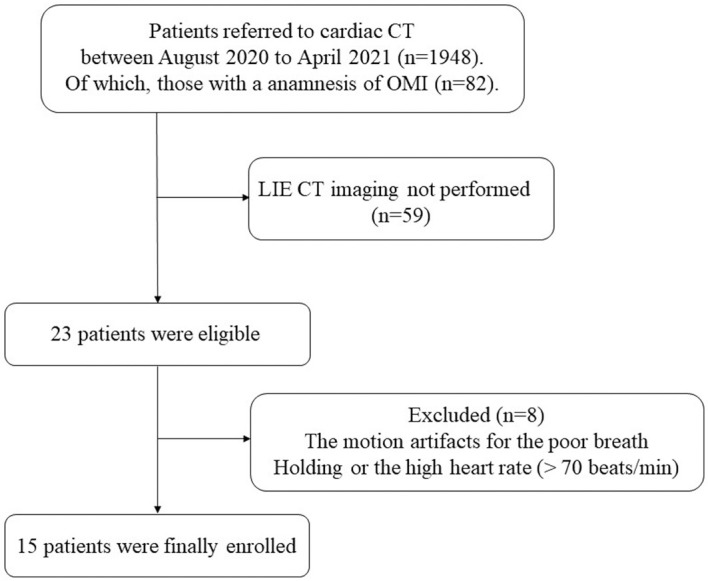
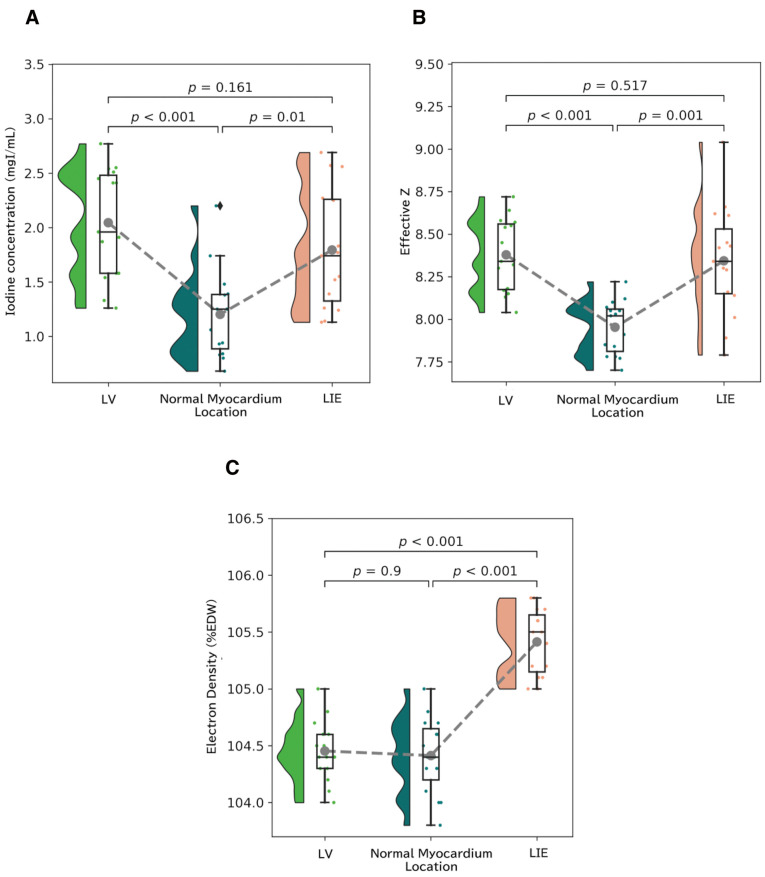
Methods and results: We retrospectively analyzed 15 patients with suspected old myocardial infarction who underwent cardiac DECT. Virtual monochromatic images (VMI) ranging from 40 to 200 keV and quantitative maps (e.g., iodine concentration, effective atomic number, and electron density [(%EDW: percentage relative to the electron density of water)] were generated. The contrast-to-noise ratio (CNR) between LIE areas and the left ventricular (LV) blood pool and normal myocardium was calculated to determine the optimal image fusion for LIE delineation. VMI at 40 keV demonstrated superior CNR between LIE areas and normal myocardium. Electron density was significantly higher in LIE areas [105.5%EDW (interquartile range (IQR): 105.15-105.65)] than in the LV blood pool [104.4%EDW (IQR: 104.3-104.6)] and normal myocardium [104.4%EDW (IQR: 104.2-104.65)] (P<0.001). Iodine concentration and effective atomic number differed significantly between LIE areas and normal myocardium, but did not differ significantly between LIE areas and the LV blood pool. Fusion of 40 keV VMI with electron density maps yielded the highest area under the receiver operating characteristic curve (0.917).
Conclusions: Fused images combining 40 keV VMI with electron density maps significantly enhanced the visualization of LIE areas on DECT, offering improved contrast and diagnostic accuracy for the assessment of myocardial territories.

 求助内容:
求助内容: 应助结果提醒方式:


