{"title":"Eye Movement Indicator Difference Based on Binocular Color Fusion and Rivalry.","authors":"Xinni Zhang, Mengshi Dai, Feiyan Cheng, Lijun Yun, Zaiqing Chen","doi":"10.3390/jemr18020010","DOIUrl":null,"url":null,"abstract":"<p><p>Color fusion and rivalry are two key information integration mechanisms in binocular vision, representing the visual system's processing patterns for consistent and conflicting inputs, respectively. This study hypothesizes that there are quantifiable differences in eye movement indicators under states of binocular color fusion and rivalry, which can be verified through multi-paradigm eye movement experiments. The experiment recruited eighteen subjects with normal vision (nine males and nine females), employing the Gaze Stability paradigm, Straight Curve Eye Hopping paradigm, and Smoothed Eye Movement Tracking paradigm for eye movement tracking. Each paradigm included a binocular color rivalry experimental group (R-G) and two binocular color fusion control groups (R-R, G-G). Data analysis indicates significant differences in indicators such as Average Saccade Amplitude, Median Saccade Amplitude, and SD of Saccade Amplitude between binocular color fusion and rivalry states. For instance, through Z-Score normalization and cross-paradigm merged analysis, specific ranges of these indicators were identified to distinguish between the two states. When the Average Saccade Amplitude falls within the range of -0.905--0.693, it indicates a state of binocular color rivalry; when the range is 0.608-1.294, it reflects a state of binocular color fusion. Subsequently, ROC curve analysis confirmed the effectiveness of the experimental paradigms in analyzing the mechanisms of binocular color fusion and rivalry, with AUC values of 0.990, 0.741, and 0.967, respectively. These results reveal the potential of eye movement behaviors as biomarkers for the dynamic processing of visual conflicts. This finding provides empirical support for understanding the neural computational models of binocular vision and lays a methodological foundation for developing visual impairment assessment tools based on eye movement features.</p>","PeriodicalId":15813,"journal":{"name":"Journal of Eye Movement Research","volume":"18 2","pages":"10"},"PeriodicalIF":2.8000,"publicationDate":"2025-04-05","publicationTypes":"Journal Article","fieldsOfStudy":null,"isOpenAccess":false,"openAccessPdf":"https://www.ncbi.nlm.nih.gov/pmc/articles/PMC12027996/pdf/","citationCount":"0","resultStr":null,"platform":"Semanticscholar","paperid":null,"PeriodicalName":"Journal of Eye Movement Research","FirstCategoryId":"3","ListUrlMain":"https://doi.org/10.3390/jemr18020010","RegionNum":4,"RegionCategory":"心理学","ArticlePicture":[],"TitleCN":null,"AbstractTextCN":null,"PMCID":null,"EPubDate":"2025/4/1 0:00:00","PubModel":"eCollection","JCR":"Q3","JCRName":"OPHTHALMOLOGY","Score":null,"Total":0}
引用次数: 0
Abstract
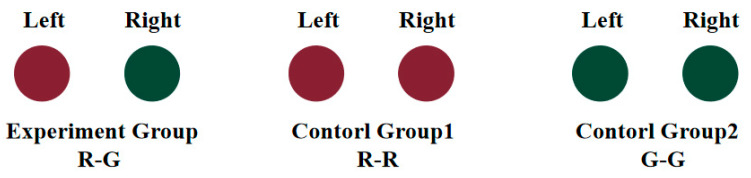
Color fusion and rivalry are two key information integration mechanisms in binocular vision, representing the visual system's processing patterns for consistent and conflicting inputs, respectively. This study hypothesizes that there are quantifiable differences in eye movement indicators under states of binocular color fusion and rivalry, which can be verified through multi-paradigm eye movement experiments. The experiment recruited eighteen subjects with normal vision (nine males and nine females), employing the Gaze Stability paradigm, Straight Curve Eye Hopping paradigm, and Smoothed Eye Movement Tracking paradigm for eye movement tracking. Each paradigm included a binocular color rivalry experimental group (R-G) and two binocular color fusion control groups (R-R, G-G). Data analysis indicates significant differences in indicators such as Average Saccade Amplitude, Median Saccade Amplitude, and SD of Saccade Amplitude between binocular color fusion and rivalry states. For instance, through Z-Score normalization and cross-paradigm merged analysis, specific ranges of these indicators were identified to distinguish between the two states. When the Average Saccade Amplitude falls within the range of -0.905--0.693, it indicates a state of binocular color rivalry; when the range is 0.608-1.294, it reflects a state of binocular color fusion. Subsequently, ROC curve analysis confirmed the effectiveness of the experimental paradigms in analyzing the mechanisms of binocular color fusion and rivalry, with AUC values of 0.990, 0.741, and 0.967, respectively. These results reveal the potential of eye movement behaviors as biomarkers for the dynamic processing of visual conflicts. This finding provides empirical support for understanding the neural computational models of binocular vision and lays a methodological foundation for developing visual impairment assessment tools based on eye movement features.
期刊介绍:
The Journal of Eye Movement Research is an open-access, peer-reviewed scientific periodical devoted to all aspects of oculomotor functioning including methodology of eye recording, neurophysiological and cognitive models, attention, reading, as well as applications in neurology, ergonomy, media research and other areas,
 求助内容:
求助内容: 应助结果提醒方式:


