Rossana Gómez-Campos, Rubén Vidal-Espinoza, Evandro Lazari, Camilo Urra-Albornoz, Luis Felipe Castelli Correia de Campos, Margot Rivera-Portugal, Marco Cossio-Bolaños
{"title":"Relationship between body mass index and lower limb power in children and adolescents.","authors":"Rossana Gómez-Campos, Rubén Vidal-Espinoza, Evandro Lazari, Camilo Urra-Albornoz, Luis Felipe Castelli Correia de Campos, Margot Rivera-Portugal, Marco Cossio-Bolaños","doi":"10.4081/ejtm.2025.13509","DOIUrl":null,"url":null,"abstract":"<p><p>Excess body weight is associated with increased mortality, low physical fitness and low levels of physical activity. The objective this study to verify the linear and nonlinear (quadratic) relationships between Body Mass Index (BMI) and lower limb strength in children and adolescents of both sexes in a region of Chile. A descriptive (cross-sectional) study was carried out in children and adolescents of school age (6 to 17 years) of both sexes. The sample size was 863 schoolchildren (500 males and 363 females). Weight, height and the Horizontal Jump test (HJ) were evaluated. BMI and BMI z -score were calculated according to age and sex. In males, the explanatory power in the linear model [R= 0.15, R2= 0.02, Root Mean Square Error (RMSE)= 39.6] is lower than the non-linear quadratic model (R= 0.22, R2= 0.05, RMSE= 39.0). In females, the explanatory power in the linear model (R= 0.12, R2= 0.02, RMSE= 23.2) is lower than the quadratic nonlinear model (R= 0.19, R2= 0.04, RMSE= 22.9). In the BMI z-score scale, males presented HJ values of: [Low BMI 145.4±39.5cm, normal 164.2±33.6cm, and high BMI 109.0±23.2cm]. In females it was: [Low BMI 108.0±23.0cm, normal 113.5±36.3cm, and elevated BMI 91.5±30.4cm]. The study verified a curvilinear relationship in the form of a parabola (quadratic) between BMI and the HJ test in children and adolescents of both sexes. Schoolchildren in the extreme BMI categories (low and high BMI) reflected low performance in the HJ in relation to school-children with normal BMI.</p>","PeriodicalId":46459,"journal":{"name":"European Journal of Translational Myology","volume":" ","pages":""},"PeriodicalIF":1.8000,"publicationDate":"2025-06-27","publicationTypes":"Journal Article","fieldsOfStudy":null,"isOpenAccess":false,"openAccessPdf":"https://www.ncbi.nlm.nih.gov/pmc/articles/PMC12265409/pdf/","citationCount":"0","resultStr":null,"platform":"Semanticscholar","paperid":null,"PeriodicalName":"European Journal of Translational Myology","FirstCategoryId":"1085","ListUrlMain":"https://doi.org/10.4081/ejtm.2025.13509","RegionNum":0,"RegionCategory":null,"ArticlePicture":[],"TitleCN":null,"AbstractTextCN":null,"PMCID":null,"EPubDate":"2025/4/4 0:00:00","PubModel":"Epub","JCR":"Q3","JCRName":"MEDICINE, RESEARCH & EXPERIMENTAL","Score":null,"Total":0}
引用次数: 0
Abstract
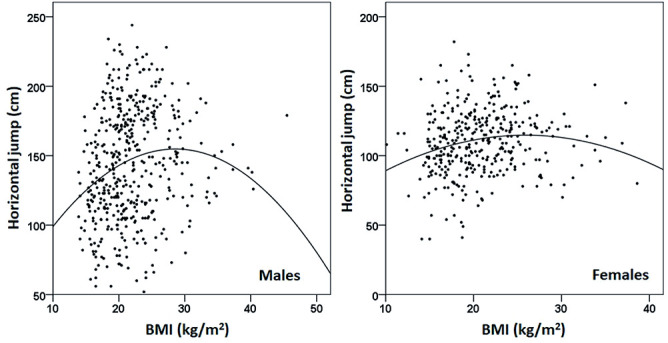
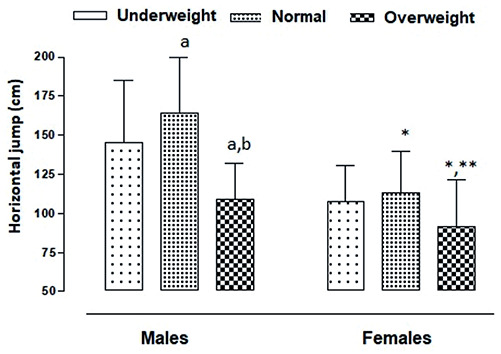
Excess body weight is associated with increased mortality, low physical fitness and low levels of physical activity. The objective this study to verify the linear and nonlinear (quadratic) relationships between Body Mass Index (BMI) and lower limb strength in children and adolescents of both sexes in a region of Chile. A descriptive (cross-sectional) study was carried out in children and adolescents of school age (6 to 17 years) of both sexes. The sample size was 863 schoolchildren (500 males and 363 females). Weight, height and the Horizontal Jump test (HJ) were evaluated. BMI and BMI z -score were calculated according to age and sex. In males, the explanatory power in the linear model [R= 0.15, R2= 0.02, Root Mean Square Error (RMSE)= 39.6] is lower than the non-linear quadratic model (R= 0.22, R2= 0.05, RMSE= 39.0). In females, the explanatory power in the linear model (R= 0.12, R2= 0.02, RMSE= 23.2) is lower than the quadratic nonlinear model (R= 0.19, R2= 0.04, RMSE= 22.9). In the BMI z-score scale, males presented HJ values of: [Low BMI 145.4±39.5cm, normal 164.2±33.6cm, and high BMI 109.0±23.2cm]. In females it was: [Low BMI 108.0±23.0cm, normal 113.5±36.3cm, and elevated BMI 91.5±30.4cm]. The study verified a curvilinear relationship in the form of a parabola (quadratic) between BMI and the HJ test in children and adolescents of both sexes. Schoolchildren in the extreme BMI categories (low and high BMI) reflected low performance in the HJ in relation to school-children with normal BMI.

 求助内容:
求助内容: 应助结果提醒方式:


