Buhlebenkosi F Mpofu, Nnenesi Kgabi, Stuart Piketh
{"title":"Analysing seasonal rainfall trends in the Cuvelai-Etosha Basin 1968-2018.","authors":"Buhlebenkosi F Mpofu, Nnenesi Kgabi, Stuart Piketh","doi":"10.4102/jamba.v17i1.1654","DOIUrl":null,"url":null,"abstract":"<p><p>This research used descriptive statistics to analyse rainfall trends in the Cuvelai- Etosha Basin (Namibia) over a 50-year historical period (1968 to 2018). The results revealed that rainfall fell over a period of 6 months between the months of November and April. Rainfall amounts were also observed to be higher in the first 3 months of each year, and annual levels ranged between 200 mm and 700 mm. The trend revealed that rainfall levels between 1977 and 1992 were consistently below the calculated average of 410 mm, and the rainfall amounts, and rain season were observed to have significantly shortened between the years 2009 and 2018. The rainfall trend observed over the 50-year period did not provide a definitive indication of whether the pattern followed a specific trajectory. The trend line's position was below the average line for many seasons, and it indicated that many of the seasons experienced rainfall levels below the annual average; however, an increase was observed from the years 2008 -2012 and the year 2018 wherein the rainfall received was above average and fell intensely over a brief period and these are the years where flooding was reported.</p><p><strong>Contribution: </strong>An epileptic pattern was observed that could not be used to definitively define a trend but was useful to highlight that there was an occurrence of episodes of heavy rainfall being experienced in the months of January through March and any resilience efforts need to be prioritised during this time.</p>","PeriodicalId":51823,"journal":{"name":"Jamba-Journal of Disaster Risk Studies","volume":"17 1","pages":"1654"},"PeriodicalIF":1.7000,"publicationDate":"2025-03-10","publicationTypes":"Journal Article","fieldsOfStudy":null,"isOpenAccess":false,"openAccessPdf":"https://www.ncbi.nlm.nih.gov/pmc/articles/PMC11967046/pdf/","citationCount":"0","resultStr":null,"platform":"Semanticscholar","paperid":null,"PeriodicalName":"Jamba-Journal of Disaster Risk Studies","FirstCategoryId":"1085","ListUrlMain":"https://doi.org/10.4102/jamba.v17i1.1654","RegionNum":0,"RegionCategory":null,"ArticlePicture":[],"TitleCN":null,"AbstractTextCN":null,"PMCID":null,"EPubDate":"2025/1/1 0:00:00","PubModel":"eCollection","JCR":"Q2","JCRName":"SOCIAL SCIENCES, INTERDISCIPLINARY","Score":null,"Total":0}
引用次数: 0
Abstract
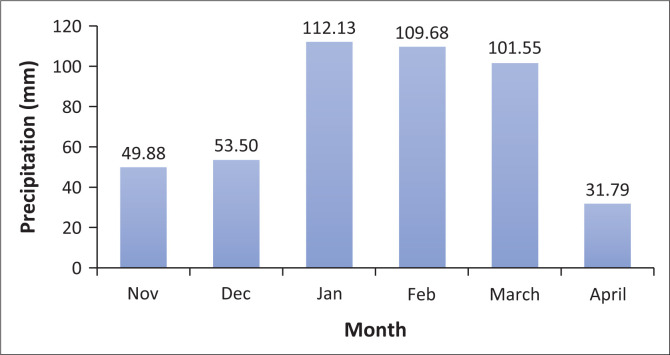
This research used descriptive statistics to analyse rainfall trends in the Cuvelai- Etosha Basin (Namibia) over a 50-year historical period (1968 to 2018). The results revealed that rainfall fell over a period of 6 months between the months of November and April. Rainfall amounts were also observed to be higher in the first 3 months of each year, and annual levels ranged between 200 mm and 700 mm. The trend revealed that rainfall levels between 1977 and 1992 were consistently below the calculated average of 410 mm, and the rainfall amounts, and rain season were observed to have significantly shortened between the years 2009 and 2018. The rainfall trend observed over the 50-year period did not provide a definitive indication of whether the pattern followed a specific trajectory. The trend line's position was below the average line for many seasons, and it indicated that many of the seasons experienced rainfall levels below the annual average; however, an increase was observed from the years 2008 -2012 and the year 2018 wherein the rainfall received was above average and fell intensely over a brief period and these are the years where flooding was reported.
Contribution: An epileptic pattern was observed that could not be used to definitively define a trend but was useful to highlight that there was an occurrence of episodes of heavy rainfall being experienced in the months of January through March and any resilience efforts need to be prioritised during this time.

 求助内容:
求助内容: 应助结果提醒方式:


