Shunyu Qiao, Jiaqiang Wang, Fuqing Li, Jing Shi, Chongfa Cai
{"title":"Spectral estimation of the aboveground biomass of cotton under water-nitrogen coupling conditions.","authors":"Shunyu Qiao, Jiaqiang Wang, Fuqing Li, Jing Shi, Chongfa Cai","doi":"10.1186/s13007-025-01358-9","DOIUrl":null,"url":null,"abstract":"<p><strong>Aims: </strong>Hyperspectral remote sensing technology can quickly obtain above-ground biomass (AGB) information of cotton, playing an important role in realizing accurate management for cotton cultivation.</p><p><strong>Methods: </strong>Using Tahe-2 as the research object, nitrogen application rates and irrigation amounts were set to 0 (N<sub>0</sub>), 100 (N<sub>1</sub>), 150 (N<sub>2</sub>), 200 (N<sub>3</sub>), 250 (N<sub>4</sub>) kg ha<sup>- 1</sup> and 4500 (W<sub>1</sub>), 6000 (W<sub>2</sub>), 7500 (W<sub>3</sub>) m³ ha<sup>- 1</sup> under the coupled conditions of water and nitrogen. Through correlation analysis between cotton AGB and canopy spectral reflectance, the intersection of feature wavelengths screened by the successive projection algorithm (SPA) and highly significant wavelengths was used as the input vector for modeling. Support vector machine (SVM), regression tree (RT), and convolutional neural network (CNN) were employed to verify the accuracy.</p><p><strong>Results: </strong>The results revealed the following: (1) The AGB of cotton at the bud stage was highest under the W<sub>1</sub>N<sub>2</sub> gradient. At the flowering stage, the highest AGB was observed under the W<sub>3</sub>N<sub>2</sub> gradient. At the boll stage, the highest AGB was under the W<sub>3</sub>N<sub>0</sub> gradient. (2) The optimal spectral model based on SVM for cotton AGB identification had higher R<sup>2</sup> values and lower RMSE values at the boll stage, with R<sup>2</sup> = 0.76, RMSE = 0.35 g and RPD = 17.59. The optimal spectral model based on RT had higher R<sup>2</sup> values and lower RMSE values at the bud stage, with R<sup>2</sup> = 0.79, RMSE = 0.24 g and RPD = 16.18. The optimal spectral model based on CNN also had higher R<sup>2</sup> values and lower RMSE values at the bud stage, with R<sup>2</sup> = 0.70, RMSE = 0.42 g and RPD = 4.50. These results indicated that the inversion effect at the bud stage was better than at other stages.</p><p><strong>Conclusions: </strong>In terms of model testing, the RT model was found to be the most accurate for estimating cotton AGB, outperforming SVM and CNN.</p>","PeriodicalId":20100,"journal":{"name":"Plant Methods","volume":"21 1","pages":"34"},"PeriodicalIF":4.4000,"publicationDate":"2025-03-12","publicationTypes":"Journal Article","fieldsOfStudy":null,"isOpenAccess":false,"openAccessPdf":"https://www.ncbi.nlm.nih.gov/pmc/articles/PMC11899358/pdf/","citationCount":"0","resultStr":null,"platform":"Semanticscholar","paperid":null,"PeriodicalName":"Plant Methods","FirstCategoryId":"99","ListUrlMain":"https://doi.org/10.1186/s13007-025-01358-9","RegionNum":2,"RegionCategory":"生物学","ArticlePicture":[],"TitleCN":null,"AbstractTextCN":null,"PMCID":null,"EPubDate":"","PubModel":"","JCR":"Q1","JCRName":"BIOCHEMICAL RESEARCH METHODS","Score":null,"Total":0}
引用次数: 0
Abstract
Aims: Hyperspectral remote sensing technology can quickly obtain above-ground biomass (AGB) information of cotton, playing an important role in realizing accurate management for cotton cultivation.
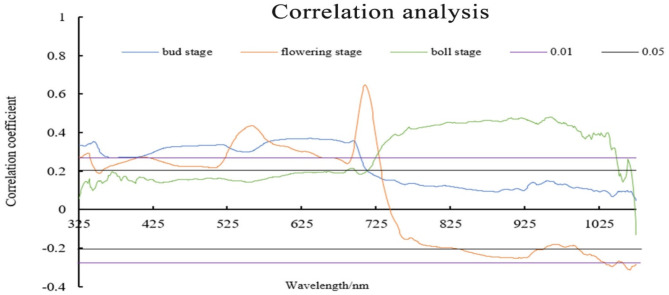
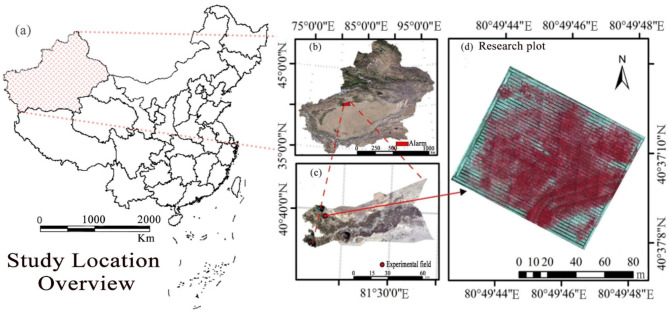
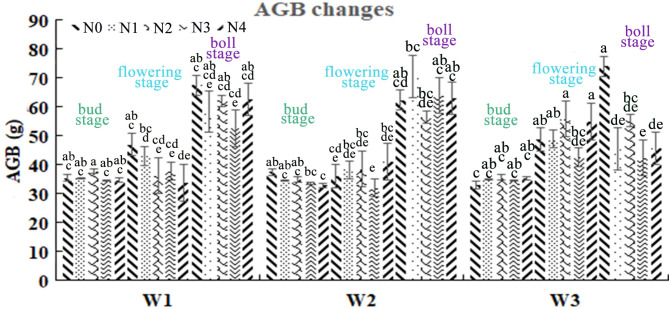
Methods: Using Tahe-2 as the research object, nitrogen application rates and irrigation amounts were set to 0 (N0), 100 (N1), 150 (N2), 200 (N3), 250 (N4) kg ha- 1 and 4500 (W1), 6000 (W2), 7500 (W3) m³ ha- 1 under the coupled conditions of water and nitrogen. Through correlation analysis between cotton AGB and canopy spectral reflectance, the intersection of feature wavelengths screened by the successive projection algorithm (SPA) and highly significant wavelengths was used as the input vector for modeling. Support vector machine (SVM), regression tree (RT), and convolutional neural network (CNN) were employed to verify the accuracy.
Results: The results revealed the following: (1) The AGB of cotton at the bud stage was highest under the W1N2 gradient. At the flowering stage, the highest AGB was observed under the W3N2 gradient. At the boll stage, the highest AGB was under the W3N0 gradient. (2) The optimal spectral model based on SVM for cotton AGB identification had higher R2 values and lower RMSE values at the boll stage, with R2 = 0.76, RMSE = 0.35 g and RPD = 17.59. The optimal spectral model based on RT had higher R2 values and lower RMSE values at the bud stage, with R2 = 0.79, RMSE = 0.24 g and RPD = 16.18. The optimal spectral model based on CNN also had higher R2 values and lower RMSE values at the bud stage, with R2 = 0.70, RMSE = 0.42 g and RPD = 4.50. These results indicated that the inversion effect at the bud stage was better than at other stages.
Conclusions: In terms of model testing, the RT model was found to be the most accurate for estimating cotton AGB, outperforming SVM and CNN.
期刊介绍:
Plant Methods is an open access, peer-reviewed, online journal for the plant research community that encompasses all aspects of technological innovation in the plant sciences.
There is no doubt that we have entered an exciting new era in plant biology. The completion of the Arabidopsis genome sequence, and the rapid progress being made in other plant genomics projects are providing unparalleled opportunities for progress in all areas of plant science. Nevertheless, enormous challenges lie ahead if we are to understand the function of every gene in the genome, and how the individual parts work together to make the whole organism. Achieving these goals will require an unprecedented collaborative effort, combining high-throughput, system-wide technologies with more focused approaches that integrate traditional disciplines such as cell biology, biochemistry and molecular genetics.
Technological innovation is probably the most important catalyst for progress in any scientific discipline. Plant Methods’ goal is to stimulate the development and adoption of new and improved techniques and research tools and, where appropriate, to promote consistency of methodologies for better integration of data from different laboratories.
 求助内容:
求助内容: 应助结果提醒方式:


