Eduardo Jerez-Olivera, Marta Gonzalez-Hernandez, Daniel Gonzalez-Hernandez, Manuel Gonzalez de la Rosa
{"title":"Estimation of normal and glaucomatous optic nerve morphology from perfusion.","authors":"Eduardo Jerez-Olivera, Marta Gonzalez-Hernandez, Daniel Gonzalez-Hernandez, Manuel Gonzalez de la Rosa","doi":"10.1136/bmjophth-2024-002024","DOIUrl":null,"url":null,"abstract":"<p><strong>Objective: </strong>To estimate the optic nerve head morphology from its haemoglobin (Hb) distribution.</p><p><strong>Methods and analysis: </strong>The optic disc of 189 normal eyes and 292 with confirmed and suspected glaucoma were analysed with Spectralis-OCT and the Laguna ONhE application using the Topcon NW400 fundus camera. Topographic Hb values were correlated with OCT tissue thicknesses from Bruch's membrane. The neuroretinal rim volume (RV), the cup volume (CV) and their relation to the globin distribution function (GDF) index of Laguna ONhE were analysed. The results were applied to 1 163 241 optic nerve images obtained in a glaucoma screening setting. Differences in segmentation and the presence of vessels without local nutritional function are the main limitations of the comparison.</p><p><strong>Results: </strong>The correlation between local Hb density and the tissue thicknesses from Bruch's membrane was R=0.953 (p<0.0001). RV could be estimated from pixel-to-pixel Hb values with an R=0.650 (p<0.0001) and from six Laguna ONhE indices with an R=0.786 (p<0.0001). CV could be estimated with an R=0.762 (p<0.0001). RV had a mean value of 0.396 mm<sup>3</sup> (SD=0.187) for positive GDF values and usually below 0.210 mm<sup>3</sup> for negative GDF. The distribution of RV values in the screening series was congruent with that found in the prospective series, with a higher value in large nerves.</p><p><strong>Conclusions: </strong>The volume and shape of the optic nerve tissue are closely related to its perfusion and can be deduced from it. The relationship between the RV and GDF is curvilinear and suggests that perfusion measurement may bring the diagnosis forward in earlier stages.</p>","PeriodicalId":9286,"journal":{"name":"BMJ Open Ophthalmology","volume":"10 1","pages":""},"PeriodicalIF":2.2000,"publicationDate":"2025-03-04","publicationTypes":"Journal Article","fieldsOfStudy":null,"isOpenAccess":false,"openAccessPdf":"https://www.ncbi.nlm.nih.gov/pmc/articles/PMC11881183/pdf/","citationCount":"0","resultStr":null,"platform":"Semanticscholar","paperid":null,"PeriodicalName":"BMJ Open Ophthalmology","FirstCategoryId":"1085","ListUrlMain":"https://doi.org/10.1136/bmjophth-2024-002024","RegionNum":0,"RegionCategory":null,"ArticlePicture":[],"TitleCN":null,"AbstractTextCN":null,"PMCID":null,"EPubDate":"","PubModel":"","JCR":"Q2","JCRName":"OPHTHALMOLOGY","Score":null,"Total":0}
引用次数: 0
Abstract
Objective: To estimate the optic nerve head morphology from its haemoglobin (Hb) distribution.
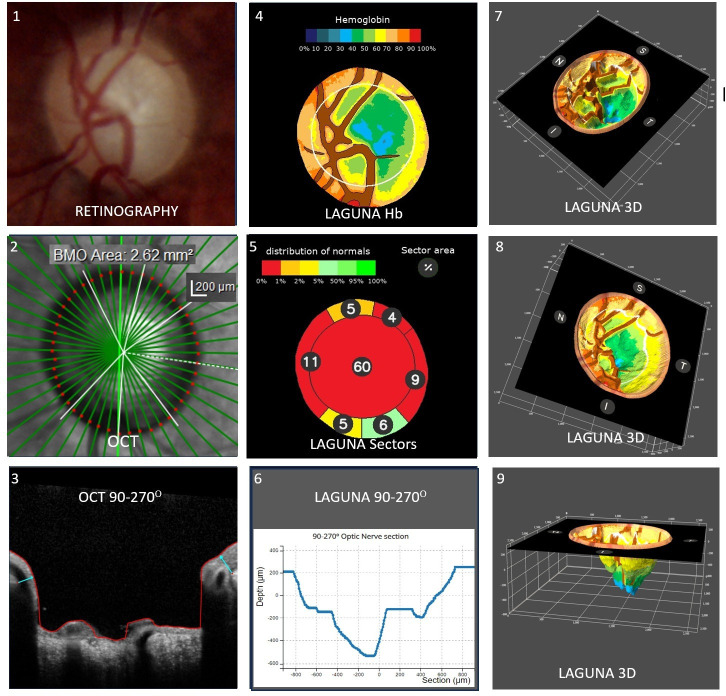
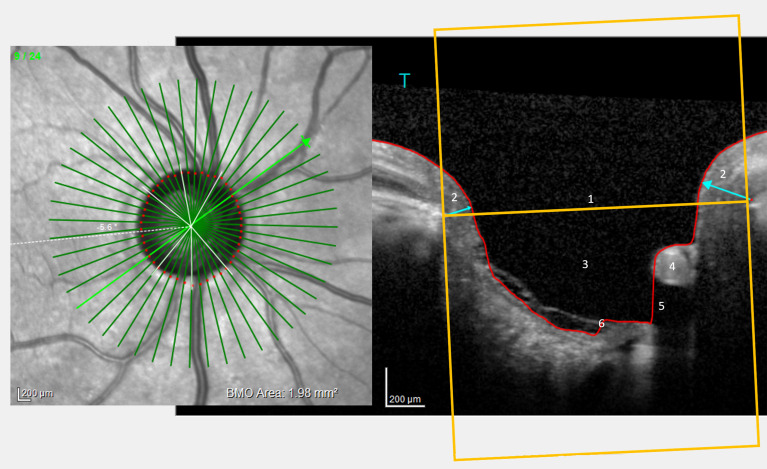
Methods and analysis: The optic disc of 189 normal eyes and 292 with confirmed and suspected glaucoma were analysed with Spectralis-OCT and the Laguna ONhE application using the Topcon NW400 fundus camera. Topographic Hb values were correlated with OCT tissue thicknesses from Bruch's membrane. The neuroretinal rim volume (RV), the cup volume (CV) and their relation to the globin distribution function (GDF) index of Laguna ONhE were analysed. The results were applied to 1 163 241 optic nerve images obtained in a glaucoma screening setting. Differences in segmentation and the presence of vessels without local nutritional function are the main limitations of the comparison.
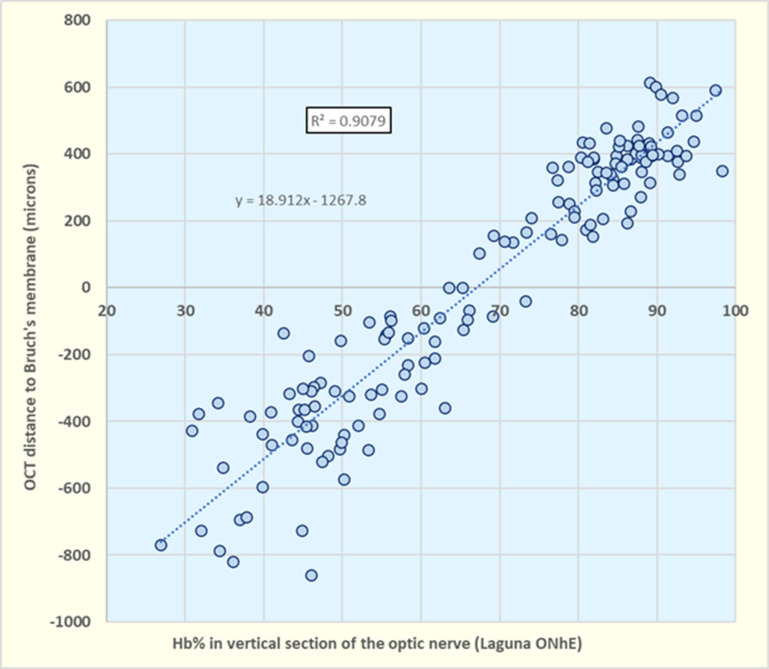
Results: The correlation between local Hb density and the tissue thicknesses from Bruch's membrane was R=0.953 (p<0.0001). RV could be estimated from pixel-to-pixel Hb values with an R=0.650 (p<0.0001) and from six Laguna ONhE indices with an R=0.786 (p<0.0001). CV could be estimated with an R=0.762 (p<0.0001). RV had a mean value of 0.396 mm3 (SD=0.187) for positive GDF values and usually below 0.210 mm3 for negative GDF. The distribution of RV values in the screening series was congruent with that found in the prospective series, with a higher value in large nerves.
Conclusions: The volume and shape of the optic nerve tissue are closely related to its perfusion and can be deduced from it. The relationship between the RV and GDF is curvilinear and suggests that perfusion measurement may bring the diagnosis forward in earlier stages.

 求助内容:
求助内容: 应助结果提醒方式:


