{"title":"Visualization of perivascular spaces in the human brain with 5-T magnetic resonance imaging.","authors":"Sirui Liu, Jianbo Li, Rui Hua, Yaowen Xing, Jiaojiao Wu, Jiang Lin, Jian Wang, Yan Shan, Lei Xu, Feng Shi, Mengsu Zeng","doi":"10.1186/s12868-025-00925-z","DOIUrl":null,"url":null,"abstract":"<p><strong>Background: </strong>To evaluate the effectiveness of 5-Tesla (T) magnetic resonance imaging (MRI) in the visualization of perivascular spaces (PVS).</p><p><strong>Method: </strong>A total of seventeen subjects underwent three-dimensional (3D) T1- and T2-weighted imaging on both 3-T and 5-T MRI systems. Twelve of these subjects underwent quantitative analysis of PVS in the semioval center (SOC) and basal ganglia (BG), with comparisons made between the two systems using paired-sample Wilcoxon tests. Additionally, high-resolution 5-T images were acquired for five other participants to examine the detailed anatomy of PVS in the SOC, BG, and cerebral cortex.</p><p><strong>Results: </strong>Compared with 3-T MRI, 5-T MRI detected more PVS in the SOC and BG [39.5 (32.0-63.0) vs. 56.5 (44.0-75.5) and 49.5 (27.0-55.8) vs. 65.5 (53.0-72.0)] with p-values of 0.002 and 0.004, respectively. In these two regions, the PVS tortuosity, defined as the ratio of the actual path length to the straight-line distance between the start and end points of the PVS, was lower at 3-T compared to 5-T (p = 0.012 for the SOC and p = 0.006 for the BG). The length of PVS in the SOC on 5-T was longer than those on 3-T [4.6 mm (3.9-6.3 mm) vs. 5.1 mm (4.6-6.7 mm), p = 0.049]. In addition, the 5-T MRI provided enhanced visualization of the morphology of PVS in vivo, and improved the depiction of PVS across various brain regions, especially in the cortex, illustrating their course and associated small vessels.</p><p><strong>Conclusions: </strong>5-T MRI notably enhanced the visualization of PVS compared to 3-T, particularly in its ability to depict PVS anatomy in the cortex using high-resolution images. This advancement may pave the way for further research into the physiological roles of PVS and their involvement in related diseases.</p>","PeriodicalId":9031,"journal":{"name":"BMC Neuroscience","volume":"26 1","pages":"18"},"PeriodicalIF":2.3000,"publicationDate":"2025-03-03","publicationTypes":"Journal Article","fieldsOfStudy":null,"isOpenAccess":false,"openAccessPdf":"https://www.ncbi.nlm.nih.gov/pmc/articles/PMC11877699/pdf/","citationCount":"0","resultStr":null,"platform":"Semanticscholar","paperid":null,"PeriodicalName":"BMC Neuroscience","FirstCategoryId":"3","ListUrlMain":"https://doi.org/10.1186/s12868-025-00925-z","RegionNum":4,"RegionCategory":"医学","ArticlePicture":[],"TitleCN":null,"AbstractTextCN":null,"PMCID":null,"EPubDate":"","PubModel":"","JCR":"Q3","JCRName":"NEUROSCIENCES","Score":null,"Total":0}
引用次数: 0
Abstract
Background: To evaluate the effectiveness of 5-Tesla (T) magnetic resonance imaging (MRI) in the visualization of perivascular spaces (PVS).
Method: A total of seventeen subjects underwent three-dimensional (3D) T1- and T2-weighted imaging on both 3-T and 5-T MRI systems. Twelve of these subjects underwent quantitative analysis of PVS in the semioval center (SOC) and basal ganglia (BG), with comparisons made between the two systems using paired-sample Wilcoxon tests. Additionally, high-resolution 5-T images were acquired for five other participants to examine the detailed anatomy of PVS in the SOC, BG, and cerebral cortex.
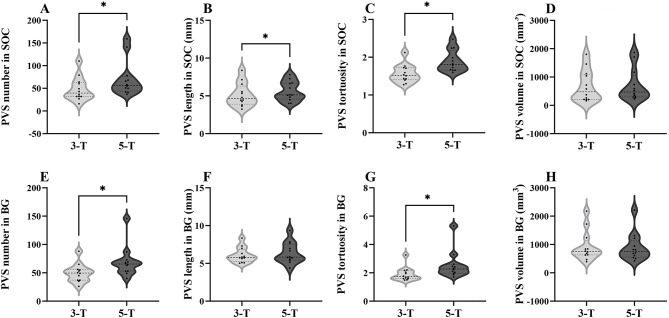
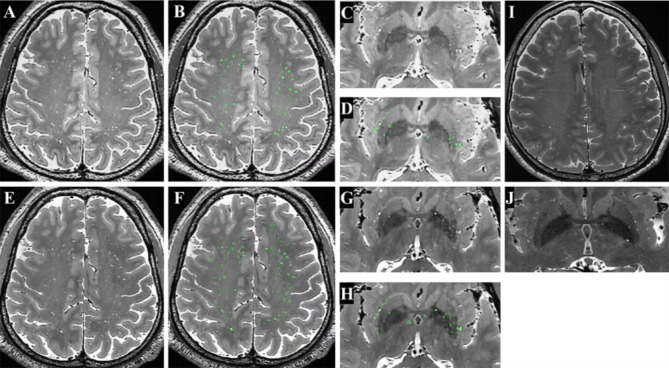
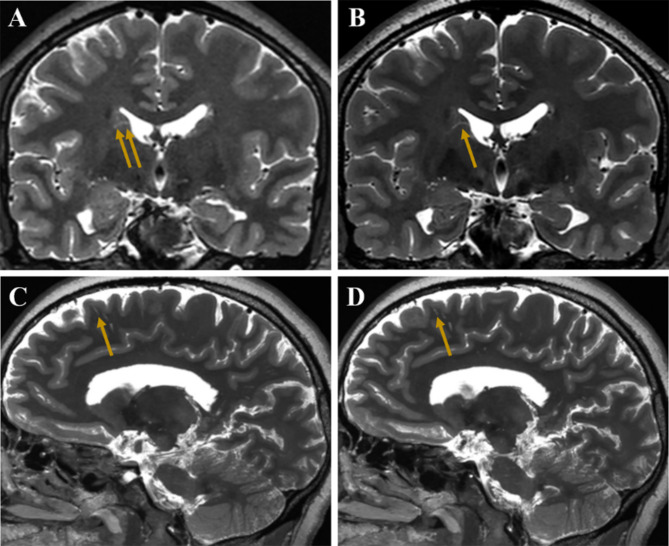
Results: Compared with 3-T MRI, 5-T MRI detected more PVS in the SOC and BG [39.5 (32.0-63.0) vs. 56.5 (44.0-75.5) and 49.5 (27.0-55.8) vs. 65.5 (53.0-72.0)] with p-values of 0.002 and 0.004, respectively. In these two regions, the PVS tortuosity, defined as the ratio of the actual path length to the straight-line distance between the start and end points of the PVS, was lower at 3-T compared to 5-T (p = 0.012 for the SOC and p = 0.006 for the BG). The length of PVS in the SOC on 5-T was longer than those on 3-T [4.6 mm (3.9-6.3 mm) vs. 5.1 mm (4.6-6.7 mm), p = 0.049]. In addition, the 5-T MRI provided enhanced visualization of the morphology of PVS in vivo, and improved the depiction of PVS across various brain regions, especially in the cortex, illustrating their course and associated small vessels.
Conclusions: 5-T MRI notably enhanced the visualization of PVS compared to 3-T, particularly in its ability to depict PVS anatomy in the cortex using high-resolution images. This advancement may pave the way for further research into the physiological roles of PVS and their involvement in related diseases.
期刊介绍:
BMC Neuroscience is an open access, peer-reviewed journal that considers articles on all aspects of neuroscience, welcoming studies that provide insight into the molecular, cellular, developmental, genetic and genomic, systems, network, cognitive and behavioral aspects of nervous system function in both health and disease. Both experimental and theoretical studies are within scope, as are studies that describe methodological approaches to monitoring or manipulating nervous system function.

 求助内容:
求助内容: 应助结果提醒方式:


