Estimating cumulative infection rate of COVID-19 after adjusting the dynamic zero-COVID policy in China
IF 2.5
3区 医学
Q1 Medicine
引用次数: 0
Abstract
Background
At the end of 2022, China adjusted its coronavirus disease 2019 (COVID-19) prevention and control strategy. How this adjustment affected the cumulative infection rate is debated, and how second booster dose vaccination affected the pandemic remains unclear.
Methods
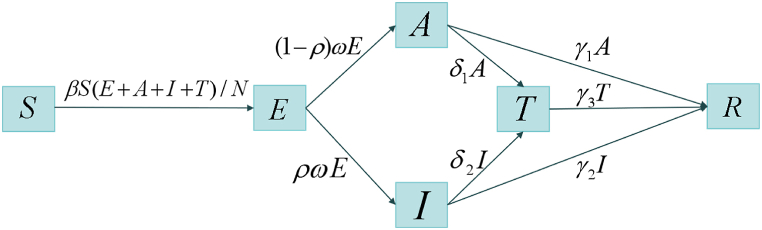
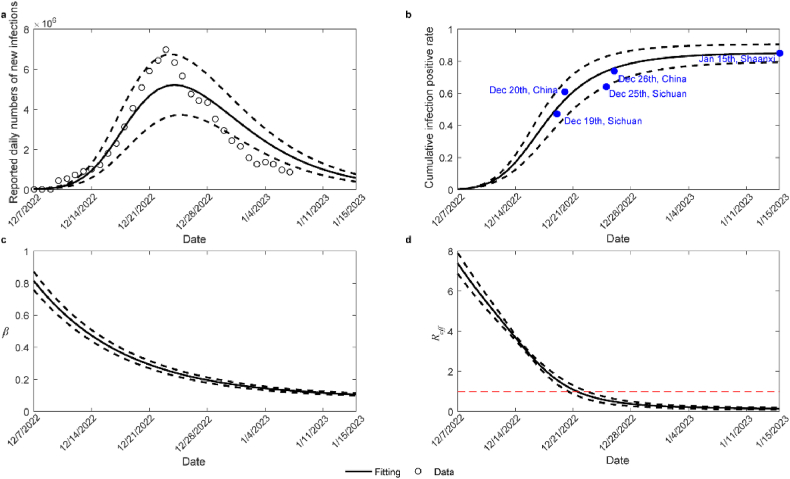
We collected COVID-19 case data for China's mainland from December 7, 2022, to January 7, 2023, reported by the World Health Organization. We also collected cumulative infection rate data from five large-scale population-based surveys. Next, we developed a dynamic transmission compartment model to characterize the COVID-19 pandemic and to estimate the cumulative infection rate. In addition, we estimated the impact of second booster vaccination on the pandemic by examining nine scenarios with different vaccination coverages (0%, 20%, and 40%) and vaccine effectiveness (30%, 50%, and 70%).
Results
By January 7, 2023, when COVID-19 was classified as a Class B infectious disease, the cumulative infection rate of the Omicron variant nationwide had reached 84.11% (95% confidence interval [CI]: 78.13%–90.08%). We estimated that the cumulative infection rates reached 50.50% (95% CI: 39.58%–61.43%), 56.15% (95% CI: 49.05%–67.22%), 73.82% (95% CI: 64.63%–83.02%), 75.76% (95% CI: 67.02%–84.50%), and 84.99% (95% CI: 79.45%–90.53%) on December 19, 20, 25, and 26, 2022, and on January 15, 2023, respectively. These results are similar to those of the population survey conducted on the corresponding dates, that is 46.93%, 61%, 63.52%, 74%, and 84.7%, respectively. In addition, we estimated that by January 7, 2023, the cumulative infection rate decreased to 29.55% (64.25%) if vaccination coverage and the effectiveness of second booster vaccination were 40% (20%) and 70% (30%), respectively.
Conclusion
We estimate that, in late 2022, the cumulative infection rate was approximately 84% and that second booster vaccination before the policy adjustment was effective in reducing this rate.
调整动态零冠政策后中国新冠肺炎累计感染率估算
背景:2022年底,中国调整了2019冠状病毒病(COVID-19)防控战略。这一调整如何影响累积感染率仍有争议,而第二次加强疫苗接种如何影响大流行仍不清楚。方法:收集世界卫生组织报告的2022年12月7日至2023年1月7日中国大陆新冠肺炎病例资料。我们还收集了5次大规模人群调查的累积感染率数据。接下来,我们建立了一个动态传播室模型来表征COVID-19大流行并估计累积感染率。此外,我们通过检查不同疫苗接种覆盖率(0%、20%和40%)和疫苗有效性(30%、50%和70%)的九种情况,估计了第二次加强疫苗接种对大流行的影响。结果:截至2023年1月7日,当COVID-19被列为B类传染病时,全国范围内Omicron变异的累积感染率已达到84.11%(95%可信区间[CI]: 78.13% ~ 90.08%)。我们估计在2022年12月19日、20日、25日、26日和2023年1月15日,累计感染率分别达到50.50% (95% CI: 39.58% ~ 61.43%)、56.15% (95% CI: 49.05% ~ 67.22%)、73.82% (95% CI: 64.63% ~ 83.02%)、75.76% (95% CI: 67.02% ~ 84.50%)和84.99% (95% CI: 79.45% ~ 90.53%)。这些结果与相应日期的人口调查结果相似,分别为46.93%、61%、63.52%、74%和84.7%。此外,我们估计,到2023年1月7日,如果疫苗接种率为40%(20%),第二次加强疫苗接种率为70%(30%),累积感染率下降到29.55%(64.25%)。结论:我们估计,在2022年末,累计感染率约为84%,在政策调整之前进行第二次加强疫苗接种可有效降低这一比率。
本文章由计算机程序翻译,如有差异,请以英文原文为准。
求助全文
约1分钟内获得全文
求助全文
来源期刊
Infectious Disease Modelling
Mathematics-Applied Mathematics
CiteScore
17.00
自引率
3.40%
发文量
73
审稿时长
17 weeks
期刊介绍:
Infectious Disease Modelling is an open access journal that undergoes peer-review. Its main objective is to facilitate research that combines mathematical modelling, retrieval and analysis of infection disease data, and public health decision support. The journal actively encourages original research that improves this interface, as well as review articles that highlight innovative methodologies relevant to data collection, informatics, and policy making in the field of public health.
 求助内容:
求助内容: 应助结果提醒方式:


