The association of Neutrophil-to-Lymphocyte ratio with metabolic syndrome in U.S. Adults: Findings from the 1999–2018 National Health and Nutrition Examination survey
IF 3.3
Q1 ENDOCRINOLOGY & METABOLISM
Journal of Clinical and Translational Endocrinology
Pub Date : 2024-12-13
DOI:10.1016/j.jcte.2024.100382
引用次数: 0
Abstract
Background
Identifying and treating metabolic syndrome (MetS) early is of great importance, as MetS portends numerous negative health outcomes. Identifying an inexpensive, readily available inflammatory biomarker that accurately predicts MetS could be of use to clinicians.
Methods
The aim of this study was to evaluate the relationship between the neutrophil-to-lymphocyte ratio (NLR) and MetS in U.S. adults. We used data from adult participants of the 1999–2018 National Health and Nutrition Examination Surveys to conduct a cross-sectional study. MetS was determined using National Cholesterol Education Program Adult Treatment Panel III (2005 revision) criteria; NLR was calculated by dividing the absolute neutrophil count by absolute lymphocyte count. Data were weighted and analyzed using survey procedures in SAS v9.4.
Results
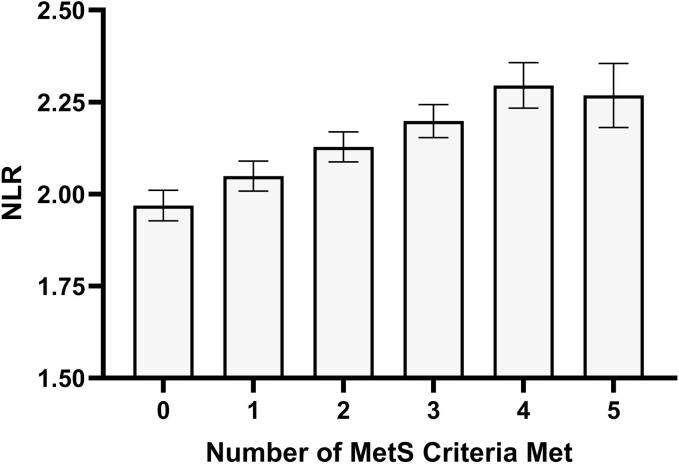
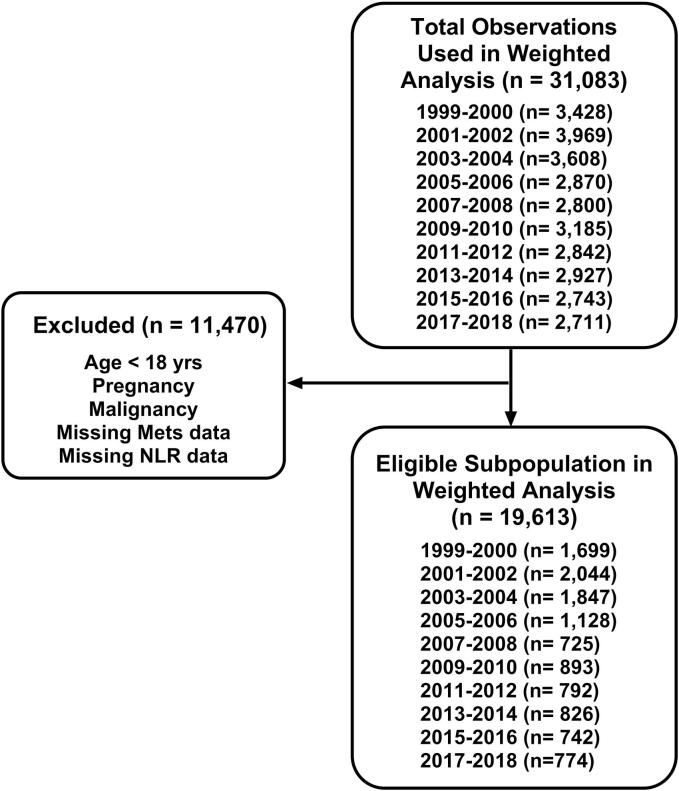
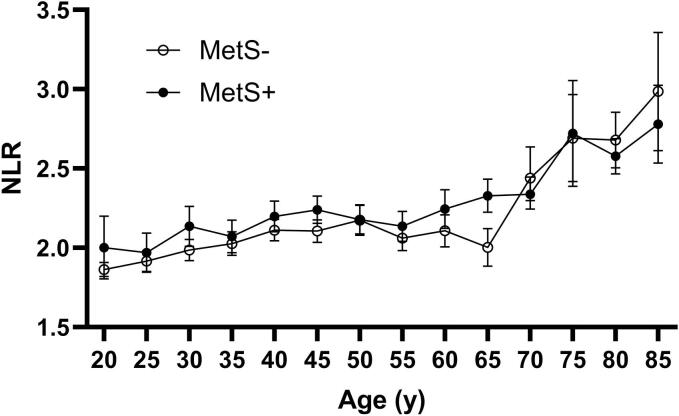
Data from 101,316 participants were reviewed, of whom 19,613 were eligible for weighted analysis. MetS was observed in 40.3 % of participants (n = 7,896), who met 3 (n = 3,902; 49.4 %), 4 (n = 2,817; 35.7 %), and 5 (n = 1,177; 14.9 %) criteria of MetS, respectively. Across the survey years, NLR was higher in those with MetS compared to those without (mean 2.24 [95 % CI 2.21, 2.28] vs 2.05 [95 % CI 2.02, 2.08]; p < 0.001). There was a consistent trend of increasing NLR according to MetS severity (p < 0.001). An NLR cutoff of 1.67 had 74.3 % sensitivity and 62.3 % specificity for MetS with Area-under-the-curve of 0.736 [95 % CI 0.73, 0.74].
Conclusions
Among U.S. adults, NLR was associated with MetS and MetS severity, independent of age and race/ethnicity.
中性粒细胞与淋巴细胞比率与美国成年人代谢综合征的关系:1999-2018年国家健康与营养调查的结果。
背景:早期识别和治疗代谢综合征(MetS)是非常重要的,因为MetS预示着许多负面的健康结果。确定一种廉价、容易获得的炎症生物标志物,准确预测MetS,可能对临床医生有用。方法:本研究的目的是评估美国成年人中性粒细胞与淋巴细胞比率(NLR)与MetS之间的关系。我们使用1999-2018年全国健康与营养检查调查的成年参与者的数据进行了横断面研究。MetS采用国家胆固醇教育计划成人治疗小组III(2005修订版)标准确定;NLR由中性粒细胞绝对计数除以淋巴细胞绝对计数计算。使用SAS v9.4中的调查程序对数据进行加权和分析。结果:101316名参与者的数据被回顾,其中19613名符合加权分析的条件。40.3%的参与者(n = 7896)出现MetS,其中达到3 (n = 3902;49.4%), 4 (n = 2,817;35.7%), 5 (n = 1177;14.9%)为met的诊断标准。在整个调查期间,met患者的NLR高于无met患者(平均值2.24 [95% CI 2.21, 2.28] vs 2.05 [95% CI 2.02, 2.08];结论:在美国成年人中,NLR与MetS和MetS严重程度相关,与年龄和种族/民族无关。
本文章由计算机程序翻译,如有差异,请以英文原文为准。
求助全文
约1分钟内获得全文
求助全文
来源期刊
Journal of Clinical and Translational Endocrinology
ENDOCRINOLOGY & METABOLISM-
CiteScore
6.10
自引率
0.00%
发文量
24
审稿时长
16 weeks
 求助内容:
求助内容: 应助结果提醒方式:


