The long-run effect of historical redlining practices on social vulnerability in U.S. cities
IF 6.6
1区 经济学
Q1 URBAN STUDIES
引用次数: 0
Abstract
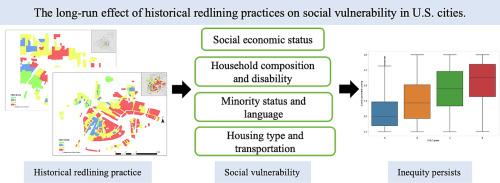
Historical redlining practices in the United States date back to the 1930s and have continued to impact cities socially, environmentally, and economically since then. This study explores current social vulnerability inequity among former HOLC (Home Owners' Loan Corporation) neighborhoods with four color-coded grades in 196 U.S. digitized cities. Social vulnerability measurements for each historical HOLC neighborhood were calculated using 2018 census tract-level social vulnerability data through areal apportionment. Kruskal-Wallis tests were employed to compare four grades of former HOLC neighborhoods regarding overall social vulnerability index (SVI), four thematic SVIs (Social economic status, Household composition and disability, Minority status and language, and Housing type and transportation), and SVIs for fifteen social vulnerability factors. After applying multiple comparison corrections, the results indicate significant differences among four HOLC grades concerning overall social vulnerability, four themes, and most of social vulnerability factors. In general, grade A (green) neighborhoods exhibit the lowest vulnerability, while grade D (red) neighborhoods have the highest vulnerability. A similar pattern of social vulnerability inequity persists even after adjusting for inter-city differences in baseline social factors using the city-normalized SVI (CSVI). This finding suggests that urban planners and policymakers should work to reduce social vulnerability inequity across neighborhoods of different grades.
历史上的红线做法对美国城市社会脆弱性的长期影响
美国历史上划定红线的做法可以追溯到20世纪30年代,并从那时起继续对城市的社会、环境和经济产生影响。本研究探讨了美国196个数字化城市中前房主贷款公司(HOLC)社区当前的社会脆弱性不平等。利用2018年人口普查区级社会脆弱性数据,通过区域分配计算每个历史HOLC社区的社会脆弱性测量值。采用Kruskal-Wallis检验比较了4个等级的前HOLC社区的总体社会脆弱性指数(SVI)、4个主题社会脆弱性指数(社会经济地位、家庭构成和残疾、少数民族地位和语言、住房类型和交通)以及15个社会脆弱性因素的SVI。经多次比较修正后,结果显示四个HOLC等级在整体社会脆弱性、四个主题和大多数社会脆弱性因素上存在显著差异。总体而言,A级(绿色)社区的脆弱性最低,D级(红色)社区的脆弱性最高。即使在使用城市标准化SVI (CSVI)调整城市间基线社会因素差异后,类似的社会脆弱性不平等模式仍然存在。这一发现表明,城市规划者和政策制定者应该努力减少不同年级社区之间的社会脆弱性不平等。
本文章由计算机程序翻译,如有差异,请以英文原文为准。
求助全文
约1分钟内获得全文
求助全文
来源期刊
Cities
URBAN STUDIES-
CiteScore
11.20
自引率
9.00%
发文量
517
期刊介绍:
Cities offers a comprehensive range of articles on all aspects of urban policy. It provides an international and interdisciplinary platform for the exchange of ideas and information between urban planners and policy makers from national and local government, non-government organizations, academia and consultancy. The primary aims of the journal are to analyse and assess past and present urban development and management as a reflection of effective, ineffective and non-existent planning policies; and the promotion of the implementation of appropriate urban policies in both the developed and the developing world.
 求助内容:
求助内容: 应助结果提醒方式:


