Nationwide analysis of air pollution hotspots across India: A spatiotemporal PM2.5 trend analysis (2008–2019)

IF 7.7 2区 环境科学与生态学 Q1 ENVIRONMENTAL SCIENCES
Suganthi Jaganathan , Ajit Rajiva , Heresh Amini , Jeroen de Bont , Shweta Dixit , Anubrati Dutta , Itai Kloog , Kevin J. Lane , Jyothi S. Menon , Amruta Nori-Sarma , Dorairaj Prabhakaran , Joel Schwartz , Praggya Sharma , Massimo Stafoggia , Gagandeep Kaur Walia , Gregory A. Wellenius , Poornima Prabhakaran , Petter Ljungman , Siddhartha Mandal
{"title":"Nationwide analysis of air pollution hotspots across India: A spatiotemporal PM2.5 trend analysis (2008–2019)","authors":"Suganthi Jaganathan ,&nbsp;Ajit Rajiva ,&nbsp;Heresh Amini ,&nbsp;Jeroen de Bont ,&nbsp;Shweta Dixit ,&nbsp;Anubrati Dutta ,&nbsp;Itai Kloog ,&nbsp;Kevin J. Lane ,&nbsp;Jyothi S. Menon ,&nbsp;Amruta Nori-Sarma ,&nbsp;Dorairaj Prabhakaran ,&nbsp;Joel Schwartz ,&nbsp;Praggya Sharma ,&nbsp;Massimo Stafoggia ,&nbsp;Gagandeep Kaur Walia ,&nbsp;Gregory A. Wellenius ,&nbsp;Poornima Prabhakaran ,&nbsp;Petter Ljungman ,&nbsp;Siddhartha Mandal","doi":"10.1016/j.envres.2024.120276","DOIUrl":null,"url":null,"abstract":"<div><h3>Introduction</h3><div>India experiences high levels of air pollution as measured by fine particulate matter &lt;2.5 μm (PM<sub>2.5</sub>) across the country. With limited resources, it is imperative to identify the most impacted areas. We aimed to identify air pollution hotspots in India and analyze temporal trends.</div></div><div><h3>Methods</h3><div>We conducted a geospatial analysis using Getis-Ord Gi statistics on gridded-annual levels of PM<sub>2.5</sub> disaggregated for every state/UT and three largest cities [Delhi, Kolkata &amp; Mumbai] of India from 2008 to 2019. The annual average PM<sub>2.5</sub> was derived from a validated and robust nationwide spatiotemporal model(1kmx1km). Hotspots were identified annually using Gi∗ score and p-value and temporal trends across 2 periods [T1:2008–2013 &amp; T2:2014–2019] for each spatial unit. We classified temporal trends based on the number of occurrences of hotspots in T1 and in T2 as consistent (similar in T1 &amp; T2), declining (decreasing in T2) and emerging (increasing in T2) hotspots.</div></div><div><h3>Results</h3><div>We identified consistent hotspots in 9.9% followed by emerging hotspots in 2.6% of the country where 16% and 4.9% people live. In addition, we identified declining hotspots in 2.6% area with 3.4% of the population. Rajasthan had largest share of area identified as consistent hotspots while Uttar Pradesh had densely populated consistent hotspots. Maharashtra had both higher number of areas identified as emerging and declining hotspots. Among the largest cities, Kolkata had highest proportion of consistent hotspots. We identified 170 additional cities with either consistent or emerging hotspots beyond the non-attainment cities as defined by the National Clean Air Programme.</div></div><div><h3>Conclusion</h3><div>India continues to have large areas of consistent and emerging hotspots of air pollution where close to a fifth of India's population live. Identifying hotspots can inform strategic approach for targeted action in air quality management, appropriate resource allocation and a baseline for assessing intervention effectiveness and future programs and policies, including health.</div></div>","PeriodicalId":312,"journal":{"name":"Environmental Research","volume":"264 ","pages":"Article 120276"},"PeriodicalIF":7.7000,"publicationDate":"2024-11-05","publicationTypes":"Journal Article","fieldsOfStudy":null,"isOpenAccess":false,"openAccessPdf":"","citationCount":"0","resultStr":null,"platform":"Semanticscholar","paperid":null,"PeriodicalName":"Environmental Research","FirstCategoryId":"93","ListUrlMain":"https://www.sciencedirect.com/science/article/pii/S0013935124021832","RegionNum":2,"RegionCategory":"环境科学与生态学","ArticlePicture":[],"TitleCN":null,"AbstractTextCN":null,"PMCID":null,"EPubDate":"","PubModel":"","JCR":"Q1","JCRName":"ENVIRONMENTAL SCIENCES","Score":null,"Total":0}
引用次数: 0

Abstract

Introduction

India experiences high levels of air pollution as measured by fine particulate matter <2.5 μm (PM2.5) across the country. With limited resources, it is imperative to identify the most impacted areas. We aimed to identify air pollution hotspots in India and analyze temporal trends.

Methods

We conducted a geospatial analysis using Getis-Ord Gi statistics on gridded-annual levels of PM2.5 disaggregated for every state/UT and three largest cities [Delhi, Kolkata & Mumbai] of India from 2008 to 2019. The annual average PM2.5 was derived from a validated and robust nationwide spatiotemporal model(1kmx1km). Hotspots were identified annually using Gi∗ score and p-value and temporal trends across 2 periods [T1:2008–2013 & T2:2014–2019] for each spatial unit. We classified temporal trends based on the number of occurrences of hotspots in T1 and in T2 as consistent (similar in T1 & T2), declining (decreasing in T2) and emerging (increasing in T2) hotspots.

Results

We identified consistent hotspots in 9.9% followed by emerging hotspots in 2.6% of the country where 16% and 4.9% people live. In addition, we identified declining hotspots in 2.6% area with 3.4% of the population. Rajasthan had largest share of area identified as consistent hotspots while Uttar Pradesh had densely populated consistent hotspots. Maharashtra had both higher number of areas identified as emerging and declining hotspots. Among the largest cities, Kolkata had highest proportion of consistent hotspots. We identified 170 additional cities with either consistent or emerging hotspots beyond the non-attainment cities as defined by the National Clean Air Programme.

Conclusion

India continues to have large areas of consistent and emerging hotspots of air pollution where close to a fifth of India's population live. Identifying hotspots can inform strategic approach for targeted action in air quality management, appropriate resource allocation and a baseline for assessing intervention effectiveness and future programs and policies, including health.
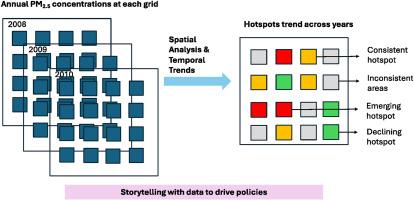
Abstract Image

印度全国空气污染热点分析:PM2.5 时空趋势分析(2008-2019 年)。
导言:印度全国的空气污染程度很高(以细颗粒物 2.5 计)。由于资源有限,当务之急是确定受影响最严重的地区。我们旨在确定印度的空气污染热点并分析其时间趋势:我们使用 Getis-Ord Gi 统计法对 2008 年至 2019 年印度各邦/中央直辖区和三个最大城市(德里、加尔各答和孟买)的 PM2.5 网格年水平进行了地理空间分析。PM2.5 的年平均值来自一个经过验证的、稳健的全国时空模型(1kmx1km)。使用 Gi∗ 分数和 p 值确定每年的热点,并确定每个空间单元在两个时期 [T1:2008-2013 年和 T2:2014-2019 年] 的时间趋势。我们根据热点在 T1 和 T2 出现的次数将时间趋势分为一致热点(T1 和 T2 相似)、下降热点(T2 下降)和新兴热点(T2 上升):我们在全国 9.9% 的地区发现了一致热点,在 2.6% 的地区发现了新热点,在这些地区分别有 16% 和 4.9% 的人居住。此外,我们还在占全国人口 3.4% 的 2.6% 的地区发现了衰退热点。拉贾斯坦邦被确定为持续热点的地区所占比例最大,而北方邦则有人口稠密的持续热点。马哈拉施特拉邦被确定为新兴热点和衰退热点的地区数量都较多。在最大的城市中,加尔各答的持续热点比例最高。除了国家清洁空气计划定义的非达标城市外,我们还发现 170 个城市存在持续热点或新兴热点:结论:印度仍有大片持续和新出现的空气污染热点地区,印度近五分之一的人口居住在这些地区。确定热点地区可为在空气质量管理中采取有针对性的行动、适当的资源分配以及评估干预效果和未来计划与政策(包括健康)的基准提供信息。
本文章由计算机程序翻译,如有差异,请以英文原文为准。
求助全文
约1分钟内获得全文 求助全文
来源期刊
Environmental Research
Environmental Research 环境科学-公共卫生、环境卫生与职业卫生
CiteScore
12.60
自引率
8.40%
发文量
2480
审稿时长
4.7 months
期刊介绍: The Environmental Research journal presents a broad range of interdisciplinary research, focused on addressing worldwide environmental concerns and featuring innovative findings. Our publication strives to explore relevant anthropogenic issues across various environmental sectors, showcasing practical applications in real-life settings.
×
引用
GB/T 7714-2015
复制
MLA
复制
APA
复制
导出至
BibTeX EndNote RefMan NoteFirst NoteExpress
×
提示
您的信息不完整,为了账户安全,请先补充。
现在去补充
×
提示
您因"违规操作"
具体请查看互助需知
我知道了
×
提示
确定
请完成安全验证×
copy
已复制链接
快去分享给好友吧!
我知道了
右上角分享
点击右上角分享
0
联系我们:info@booksci.cn Book学术提供免费学术资源搜索服务,方便国内外学者检索中英文文献。致力于提供最便捷和优质的服务体验。 Copyright © 2023 布克学术 All rights reserved.
京ICP备2023020795号-1
ghs 京公网安备 11010802042870号
Book学术文献互助
Book学术文献互助群
群 号:481959085
Book学术官方微信