Structural, morphological and photoluminescence studies of Ca7Mg2P6O24:RE3+(RE3+= Tb3+, Dy3+) nanophosphor for solid state illumination
IF 3.8
Q2 CHEMISTRY, PHYSICAL
引用次数: 0
Abstract
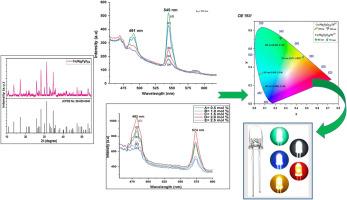
The Ca7Mg2P6O24:RE3+ (RE3+= Tb3+, Dy3+) nanophosphor material was synthesized by traditional wet chemical method. The XRD are used to determine phase and crystallinity of the synthesized sample; further FTIR, SEM, TEM, and PL properties were studied. The XRD pattern of prepared sample match well with standard JCPDS card no 00–020–0348, and it exhibits the rhombohedral structure along with space group R3c (161). The phosphate (PO4)3-group absorption band was observed at 990–1100 cm-1 in FTIR. Surface morphology (TEM analysis) reveals particle sizes in the range of 55–110 nm. The luminescence emission spectra of Ca7Mg2P6O24 phosphor activated by Tb3+ were studied at three different excitations: 352 nm, 370 nm, and 379 nm. The spectra show two emission peaks at 470 nm (blue) and 545 nm (green). These are due to the 5D4 → 7F6 and 5D4 → 7F5 transitions of Tb3+ ions. The highest intensity peak is located at 545 nm. The Ca7Mg2P6O24:Tb3+ phosphor's CIE chromaticity coordinates are (0.040, 0.316) at 491 nm and (0.265, 0.724) at 543 nm. These are in the blue and green areas on the edges of the CIE diagram, respectively. The photoluminescence emission spectra of Dy3+-doped Ca7Mg2P6O24 phosphor show two significant emission peaks located at 482 nm and 574 nm. These are caused by the 4F9/2 → 5H15/2 and 4F9/2 → 6H13/2 transitions of Dy3+ ions, which produce blue and yellow light, respectively, with an excitation wavelength of 350 nm. The sharp peak position at 482 nm produces the strongest emission. The effect of concentration quenching in between the Dy3+-Dy3+ions and Tb3+-Tb3+ ions is due to dipole-dipole interaction. The CIE color coordinate is found to be (0.082, 0.156) at 482 nm and (0.471, 0.527) at 574 nm which lies in blue and yellow border of CIE diagram. The lifespan of Tb3+, Dy3+activated Ca7Mg2P6O24 nanophosphor of highest concentration is found to be 1.917 ms and 0.9985 ms respectively. On investigation, the synthesized Tb3+, Dy3+activated Ca7Mg2P6O24 nanophosphor can be potential for solid lightning devices & other display application.

固态照明用 Ca7Mg2P6O24:RE3+(RE3+= Tb3+、Dy3+)纳米荧光粉的结构、形态和光致发光研究
采用传统的湿化学方法合成了 Ca7Mg2P6O24:RE3+(RE3+= Tb3+、Dy3+)纳米磷材料。XRD 被用来确定合成样品的相位和结晶度;傅立叶变换红外光谱、扫描电子显微镜、电子显微镜和光致发光特性被进一步研究。所制备样品的 X 射线衍射图与 JCPDS 编号为 00-020-0348 的标准卡完全吻合,呈斜方体结构,空间群为 R3c (161)。傅立叶变换红外光谱在 990-1100 cm-1 处观察到磷酸(PO4)3 基团吸收带。表面形貌(TEM 分析)显示颗粒大小在 55-110 nm 之间。研究了 Tb3+ 激活的 Ca7Mg2P6O24 荧光粉在三种不同激发下的发光发射光谱:352 nm、370 nm 和 379 nm。光谱在 470 纳米(蓝色)和 545 纳米(绿色)处显示出两个发射峰。这是由于 Tb3+ 离子的 5D4 → 7F6 和 5D4 → 7F5 转变造成的。最高强度峰位于 545 纳米波长处。Ca7Mg2P6O24:Tb3+ 荧光粉的 CIE 色度坐标为 491 纳米波长处的 (0.040, 0.316) 和 543 纳米波长处的 (0.265, 0.724)。它们分别位于 CIE 图边缘的蓝色和绿色区域。掺杂了 Dy3+ 的 Ca7Mg2P6O24 荧光粉的光致发光发射光谱在 482 nm 和 574 nm 处显示出两个显著的发射峰。这是由 Dy3+ 离子的 4F9/2 → 5H15/2 和 4F9/2 → 6H13/2 转变引起的,在 350 nm 的激发波长下分别产生蓝光和黄光。波长为 482 nm 的尖峰位置产生最强的发射。Dy3+-Dy3+ 离子和 Tb3+-Tb3+ 离子之间的浓度淬灭效应是由偶极-偶极相互作用引起的。CIE 色坐标在 482 纳米处为(0.082, 0.156),在 574 纳米处为(0.471, 0.527),分别位于 CIE 图的蓝色和黄色边界。最高浓度的 Tb3+、Dy3+ 活化 Ca7Mg2P6O24 纳米荧光粉的寿命分别为 1.917 毫秒和 0.9985 毫秒。经研究,合成的 Tb3+、Dy3+活化 Ca7Mg2P6O24 纳米荧光粉有可能用于固体闪电装置和amp;其他显示应用。
本文章由计算机程序翻译,如有差异,请以英文原文为准。
求助全文
约1分钟内获得全文
求助全文
来源期刊

Chemical Physics Impact
Materials Science-Materials Science (miscellaneous)
CiteScore
2.60
自引率
0.00%
发文量
65
审稿时长
46 days
 求助内容:
求助内容: 应助结果提醒方式:


