{"title":"Trends in the yield response to nitrogen of winter wheat in Oklahoma","authors":"Amadeo F. Panyi, B. Wade Brorsen","doi":"10.1002/ael2.20143","DOIUrl":null,"url":null,"abstract":"<div>\n \n <section>\n \n \n <p>This study seeks to explain how the response of winter wheat (<i>Triticum aestivum L</i>.) to nitrogen at Lahoma, OK, has changed over time. This objective was motivated by the need for accurate estimation of optimal nitrogen recommendations and to understand why optimal nitrogen rates have changed over time. Yields increased over time, except at the 0 and 22 kg N ha<sup>−1</sup> rates of applied nitrogen. Bayesian methods were used to estimate linear plateau models where each parameter has its own time trend. Results show no trend in intercept, an increase of 1.3% per year in the slope coefficient, a 1.9% per year increase in the difference between the plateau and intercept, and a 33% increase in the optimal nitrogen rates from 1971 to 2023. These trends suggest the need to update nitrogen recommendations and help explain why the yield goal approach became imprecise over time due to changing yield potential.</p>\n </section>\n \n <section>\n \n <h3> Core Ideas</h3>\n \n <div>\n <ul>\n \n <li>The yield of winter wheat went up over time with nitrogen rates of 45 kg N ha<sup>−1</sup> or higher.</li>\n \n <li>The yield on check plots with no nitrogen did not change.</li>\n \n <li>The slope and plateau of the linear plateau model of wheat yield response went up over 1% per year.</li>\n \n <li>Optimal nitrogen went up over 33% over time based on the estimated linear response stochastic plateau model.</li>\n </ul>\n </div>\n </section>\n </div>","PeriodicalId":48502,"journal":{"name":"Agricultural & Environmental Letters","volume":"9 2","pages":""},"PeriodicalIF":3.6000,"publicationDate":"2024-08-13","publicationTypes":"Journal Article","fieldsOfStudy":null,"isOpenAccess":false,"openAccessPdf":"https://onlinelibrary.wiley.com/doi/epdf/10.1002/ael2.20143","citationCount":"0","resultStr":null,"platform":"Semanticscholar","paperid":null,"PeriodicalName":"Agricultural & Environmental Letters","FirstCategoryId":"97","ListUrlMain":"https://acsess.onlinelibrary.wiley.com/doi/10.1002/ael2.20143","RegionNum":4,"RegionCategory":"农林科学","ArticlePicture":[],"TitleCN":null,"AbstractTextCN":null,"PMCID":null,"EPubDate":"","PubModel":"","JCR":"Q1","JCRName":"AGRICULTURE, MULTIDISCIPLINARY","Score":null,"Total":0}
引用次数: 0
Abstract
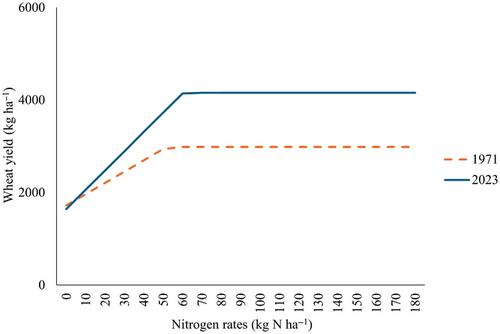
This study seeks to explain how the response of winter wheat (Triticum aestivum L.) to nitrogen at Lahoma, OK, has changed over time. This objective was motivated by the need for accurate estimation of optimal nitrogen recommendations and to understand why optimal nitrogen rates have changed over time. Yields increased over time, except at the 0 and 22 kg N ha−1 rates of applied nitrogen. Bayesian methods were used to estimate linear plateau models where each parameter has its own time trend. Results show no trend in intercept, an increase of 1.3% per year in the slope coefficient, a 1.9% per year increase in the difference between the plateau and intercept, and a 33% increase in the optimal nitrogen rates from 1971 to 2023. These trends suggest the need to update nitrogen recommendations and help explain why the yield goal approach became imprecise over time due to changing yield potential.
Core Ideas
The yield of winter wheat went up over time with nitrogen rates of 45 kg N ha−1 or higher.
The yield on check plots with no nitrogen did not change.
The slope and plateau of the linear plateau model of wheat yield response went up over 1% per year.
Optimal nitrogen went up over 33% over time based on the estimated linear response stochastic plateau model.

 求助内容:
求助内容: 应助结果提醒方式:


