{"title":"Impact of Dead Fish Degradation on the Monitoring of Fish Losses in the Pregrowing and Growing Phase of Caged European Sea Bass (Dicentrarchus labrax)","authors":"Housni Chadli, Ikram Ennayer, Abdeljallil Bahida, Hassan Nhhala, Hassan Er-Raioui","doi":"10.1155/2024/8369485","DOIUrl":null,"url":null,"abstract":"<div>\n <p>The interplay between environmental, biological, and physical factors often leads to the deterioration of dead fish in marine cages prior to their removal. Depending on the weight of the dead fish and the frequency of their removal, deterioration can progress to a stage where visual identification by divers becomes challenging, thereby disrupting accurate counting of dead fish. This study presents a practical precision tool for monitoring the number of dead fish during the pregrowth and growth phases of caged European sea bass (<i>Dicentrarchus labrax</i>). To improve the assessment of collected mortality, experiments were conducted in farming cages with various fish weights. Identifiable fish rates (<i>I</i>, %) were calculated every 24 hr and classified into four weight classes: WC1 (4–15 g), WC2 (15–30 g), WC3 (30–80 g), and WC4 (>80 g). The corrected number of dead fish (M) was calculated by dividing the collected number (C) by a correction factor (McR), which was determined based on the adopted removal frequency. The possible mortality removal frequencies per week (Fn) included operations such as F7 (daily), F3 (3 times), F2 (2 times), and F1 (once). The smallest correction denominator was 22% for WC1 at a frequency of once per week, whereas the maximum was 100% for WC3 and WC4 daily. The results revealed a high negative significant correlation between Fn and uncollected degraded fish rate (UR) (<i>r</i> = –0.841, <i>p</i> < 0.05). Applying corrections to mortality collected in three finished batches (B2, B3, and B7) led to an increase in the mortality rate by 3.9% ± 1.5%, 5.5% ± 0.7%, and 5.0% ± 0.5%, respectively. This explained 16.8% ± 4.7%, 65.5% ± 26.7%, and 30.3% ± 3.7% of fish disappearances in B2, B3, and B7, respectively. The significance of this study lies in its practical applicability to fish farms as a precise tool for monitoring fish raised in marine cages.</p>\n </div>","PeriodicalId":8104,"journal":{"name":"Aquaculture Research","volume":null,"pages":null},"PeriodicalIF":1.9000,"publicationDate":"2024-07-09","publicationTypes":"Journal Article","fieldsOfStudy":null,"isOpenAccess":false,"openAccessPdf":"https://onlinelibrary.wiley.com/doi/epdf/10.1155/2024/8369485","citationCount":"0","resultStr":null,"platform":"Semanticscholar","paperid":null,"PeriodicalName":"Aquaculture Research","FirstCategoryId":"97","ListUrlMain":"https://onlinelibrary.wiley.com/doi/10.1155/2024/8369485","RegionNum":4,"RegionCategory":"农林科学","ArticlePicture":[],"TitleCN":null,"AbstractTextCN":null,"PMCID":null,"EPubDate":"","PubModel":"","JCR":"Q2","JCRName":"FISHERIES","Score":null,"Total":0}
引用次数: 0
Abstract
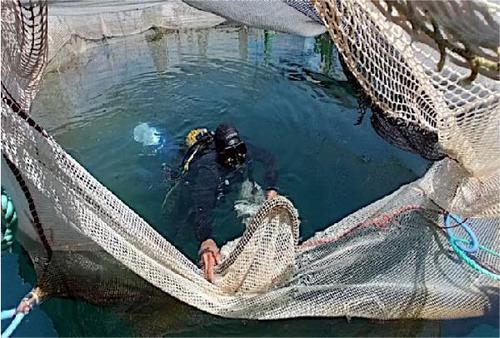
The interplay between environmental, biological, and physical factors often leads to the deterioration of dead fish in marine cages prior to their removal. Depending on the weight of the dead fish and the frequency of their removal, deterioration can progress to a stage where visual identification by divers becomes challenging, thereby disrupting accurate counting of dead fish. This study presents a practical precision tool for monitoring the number of dead fish during the pregrowth and growth phases of caged European sea bass (Dicentrarchus labrax). To improve the assessment of collected mortality, experiments were conducted in farming cages with various fish weights. Identifiable fish rates (I, %) were calculated every 24 hr and classified into four weight classes: WC1 (4–15 g), WC2 (15–30 g), WC3 (30–80 g), and WC4 (>80 g). The corrected number of dead fish (M) was calculated by dividing the collected number (C) by a correction factor (McR), which was determined based on the adopted removal frequency. The possible mortality removal frequencies per week (Fn) included operations such as F7 (daily), F3 (3 times), F2 (2 times), and F1 (once). The smallest correction denominator was 22% for WC1 at a frequency of once per week, whereas the maximum was 100% for WC3 and WC4 daily. The results revealed a high negative significant correlation between Fn and uncollected degraded fish rate (UR) (r = –0.841, p < 0.05). Applying corrections to mortality collected in three finished batches (B2, B3, and B7) led to an increase in the mortality rate by 3.9% ± 1.5%, 5.5% ± 0.7%, and 5.0% ± 0.5%, respectively. This explained 16.8% ± 4.7%, 65.5% ± 26.7%, and 30.3% ± 3.7% of fish disappearances in B2, B3, and B7, respectively. The significance of this study lies in its practical applicability to fish farms as a precise tool for monitoring fish raised in marine cages.
期刊介绍:
International in perspective, Aquaculture Research is published 12 times a year and specifically addresses research and reference needs of all working and studying within the many varied areas of aquaculture. The Journal regularly publishes papers on applied or scientific research relevant to freshwater, brackish, and marine aquaculture. It covers all aquatic organisms, floristic and faunistic, related directly or indirectly to human consumption. The journal also includes review articles, short communications and technical papers. Young scientists are particularly encouraged to submit short communications based on their own research.
 求助内容:
求助内容: 应助结果提醒方式:


