Jessica M Farinha, Peter R Bartel, Piet J Becker, Lynton T Hazelhurst
{"title":"Short-Term Changes in Hypsarrhythmia Assessed by Spectral Analysis: Group and Individual Assessments.","authors":"Jessica M Farinha, Peter R Bartel, Piet J Becker, Lynton T Hazelhurst","doi":"10.1177/15500594241258558","DOIUrl":null,"url":null,"abstract":"<p><p><b>Objectives:</b> To perform spectral analysis on previously recorded electroencephalograms (EEGs) containing hypsarrhythmia in an initial recording and to assess changes in spectral power (µV<sup>2</sup>) in a follow-up recording after a period of 10-25 days. <b>Methods:</b> Fifty participants, aged 2-39 months, with hypsarrhythmia in an initial recording (R1), were compared with regard to their spectral findings in a later recording (R2). Typically, anticonvulsant therapy was initiated or modified after R1. Average delta, theta, alpha, and beta power was derived from approximately 3 min of artifact-free EEG data recorded from 19 electrode derivations. Group and individual changes in delta power between R1 and R2 formed the main analyses. <b>Results:</b> Delta accounted for 84% of the total power. In group comparisons, median delta power decreased statistically significantly between R1 and R2 in all 19 derivations, for example, from 3940 µV<sup>2</sup> in R1 to 1722 µV<sup>2</sup> in R2, Cz derivation. When assessing individual participants, delta power decreases in R2 were >50% in 60% of the participants, but <25% in 24% of the participants. <b>Conclusion:</b> Spectral analysis may be used as an additional tool for providing a potential biomarker in the assessment of short-term changes in hypsarrhythmia, including the effects of treatment.</p>","PeriodicalId":93940,"journal":{"name":"Clinical EEG and neuroscience","volume":" ","pages":"159-164"},"PeriodicalIF":1.7000,"publicationDate":"2025-03-01","publicationTypes":"Journal Article","fieldsOfStudy":null,"isOpenAccess":false,"openAccessPdf":"https://www.ncbi.nlm.nih.gov/pmc/articles/PMC11800695/pdf/","citationCount":"0","resultStr":null,"platform":"Semanticscholar","paperid":null,"PeriodicalName":"Clinical EEG and neuroscience","FirstCategoryId":"1085","ListUrlMain":"https://doi.org/10.1177/15500594241258558","RegionNum":0,"RegionCategory":null,"ArticlePicture":[],"TitleCN":null,"AbstractTextCN":null,"PMCID":null,"EPubDate":"2024/6/3 0:00:00","PubModel":"Epub","JCR":"","JCRName":"","Score":null,"Total":0}
引用次数: 0
Abstract
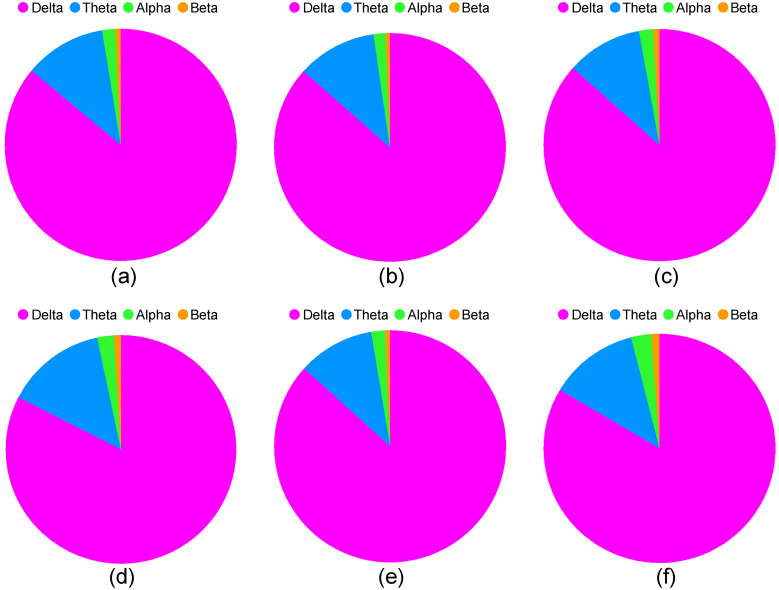
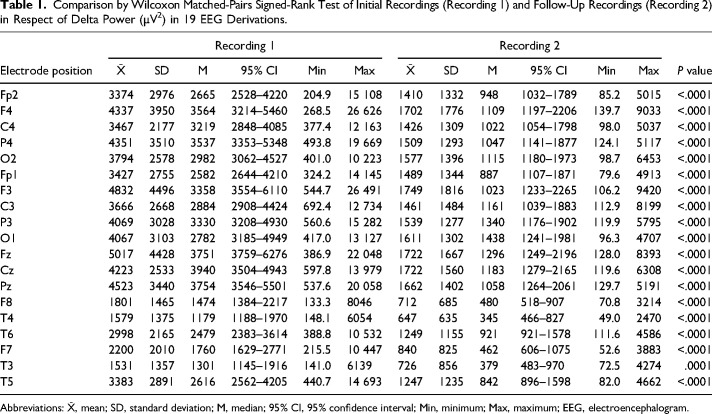
Objectives: To perform spectral analysis on previously recorded electroencephalograms (EEGs) containing hypsarrhythmia in an initial recording and to assess changes in spectral power (µV2) in a follow-up recording after a period of 10-25 days. Methods: Fifty participants, aged 2-39 months, with hypsarrhythmia in an initial recording (R1), were compared with regard to their spectral findings in a later recording (R2). Typically, anticonvulsant therapy was initiated or modified after R1. Average delta, theta, alpha, and beta power was derived from approximately 3 min of artifact-free EEG data recorded from 19 electrode derivations. Group and individual changes in delta power between R1 and R2 formed the main analyses. Results: Delta accounted for 84% of the total power. In group comparisons, median delta power decreased statistically significantly between R1 and R2 in all 19 derivations, for example, from 3940 µV2 in R1 to 1722 µV2 in R2, Cz derivation. When assessing individual participants, delta power decreases in R2 were >50% in 60% of the participants, but <25% in 24% of the participants. Conclusion: Spectral analysis may be used as an additional tool for providing a potential biomarker in the assessment of short-term changes in hypsarrhythmia, including the effects of treatment.

 求助内容:
求助内容: 应助结果提醒方式:


