Visual Inference and Graphical Representation in Regression Discontinuity Designs
IF 12.7
1区 经济学
Q1 ECONOMICS
引用次数: 1
Abstract
Abstract Despite the widespread use of graphs in empirical research, little is known about readers’ ability to process the statistical information they are meant to convey (“visual inference”). We study visual inference in the context of regression discontinuity (RD) designs by measuring how accurately readers identify discontinuities in graphs produced from data-generating processes calibrated on 11 published papers from leading economics journals. First, we assess the effects of different graphical representation methods on visual inference using randomized experiments. We find that bin widths and fit lines have the largest effects on whether participants correctly perceive the presence or absence of a discontinuity. Our experimental results allow us to make evidence-based recommendations to practitioners, and we suggest using small bins with no fit lines as a starting point to construct RD graphs. Second, we compare visual inference on graphs constructed using our preferred method with widely used econometric inference procedures. We find that visual inference achieves similar or lower type I error (false positive) rates and complements econometric inference.回归不连续设计中的视觉推理与图形表示
尽管在实证研究中广泛使用图表,但读者处理统计信息的能力(“视觉推理”)却知之甚少。我们研究了回归不连续(RD)设计背景下的视觉推理,通过测量读者在数据生成过程中识别不连续图的准确性,这些图表是根据11篇发表在主要经济学期刊上的论文进行校准的。首先,我们通过随机实验评估了不同图形表示方法对视觉推理的影响。我们发现,bin宽度和拟合线对参与者是否正确感知不连续性的存在或不存在有最大的影响。我们的实验结果使我们能够向从业者提出基于证据的建议,并且我们建议使用没有拟合线的小箱子作为构建RD图的起点。其次,我们比较了使用我们的首选方法构建的图形的视觉推理与广泛使用的计量经济学推理程序。我们发现视觉推理达到相似或更低的I型错误率(假阳性),并补充计量经济学推理。
本文章由计算机程序翻译,如有差异,请以英文原文为准。
求助全文
约1分钟内获得全文
求助全文
来源期刊

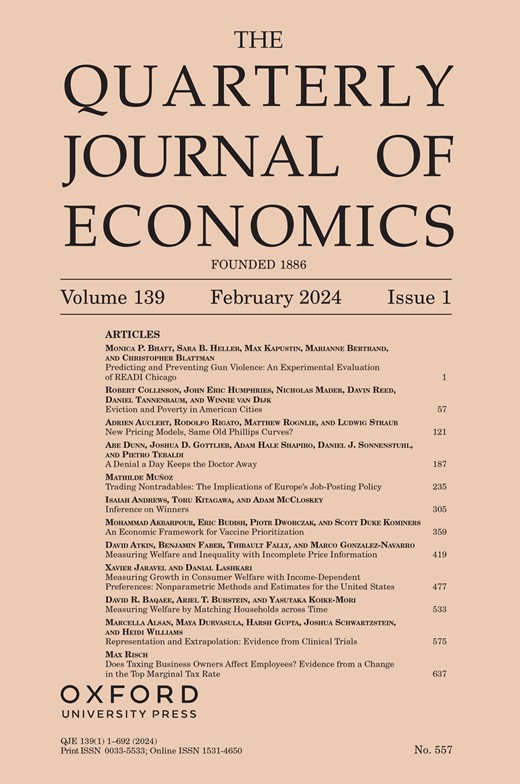
Quarterly Journal of Economics
ECONOMICS-
CiteScore
24.20
自引率
2.20%
发文量
42
期刊介绍:
The Quarterly Journal of Economics stands as the oldest professional journal of economics in the English language. Published under the editorial guidance of Harvard University's Department of Economics, it comprehensively covers all aspects of the field. Esteemed by professional and academic economists as well as students worldwide, QJE holds unparalleled value in the economic discourse.
 求助内容:
求助内容: 应助结果提醒方式:


