David A. Parker , Rebekah L. Trotti , Jennifer E. McDowell , Sarah K. Keedy , Elliot S. Gershon , Elena I. Ivleva , Godfrey D. Pearlson , Matcheri S. Keshavan , Carol A. Tamminga , John A. Sweeney , Brett A. Clementz
{"title":"Auditory paired-stimuli responses across the psychosis and bipolar spectrum and their relationship to clinical features","authors":"David A. Parker , Rebekah L. Trotti , Jennifer E. McDowell , Sarah K. Keedy , Elliot S. Gershon , Elena I. Ivleva , Godfrey D. Pearlson , Matcheri S. Keshavan , Carol A. Tamminga , John A. Sweeney , Brett A. Clementz","doi":"10.1016/j.bionps.2020.100014","DOIUrl":null,"url":null,"abstract":"<div><h3>Background</h3><p>EEG responses during auditory paired-stimuli paradigms are putative biomarkers of psychosis syndromes. The initial iteration of the Bipolar-Schizophrenia Network on Intermediate Phenotypes (B-SNIP1) showed unique and common patterns of abnormalities across schizophrenia (SZ), schizoaffective disorder (SAD), and bipolar disorder with psychosis (BDP). This study replicates those findings in new and large samples of psychosis cases and extends them to an important comparison group, bipolar disorder without psychosis (BDNP).</p></div><div><h3>Methods</h3><p>Paired stimuli responses from 64-sensor EEG recording were compared across psychosis (n = 597; SZ = 225, SAD = 201, BDP = 171), BDNP (n = 66), and healthy (n = 415) subjects from the second iteration of B-SNIP. EEG activity was analyzed in voltage and in the time-frequency domain. Principal component analysis (PCA) over sensors (sPCA) was used to efficiently capture EEG voltage responses to the paired stimuli. Evoked power was calculated via a Morlet wavelet procedure. A frequency PCA divided evoked power data into three frequency bands: Low (4−17 Hz), Beta (18−32 Hz), and Gamma (33−55 Hz). Each time-course (ERP Voltage, Low, Beta, and Gamma) were then segmented into 20 ms bins and analyzed for group differences. To efficiently summarize the multiple EEG components that best captured group differences we used multivariate discriminant and correlational analyses. This approach yields a reduced set of measures that may be useful in subsequent biomarker investigations.</p></div><div><h3>Results</h3><p>Group ANOVAs identified 17 time-ranges that showed significant group differences (p < .05 after FDR correction), constructively replicating B-SNIP1 findings. Multivariate linear discriminant analysis parsimoniously selected variables that best accounted for group differences: The P50 response to S1 and S2 uniquely separated BDNP from healthy and psychosis subjects (BDNP > all other groups); the S1 N100 response separated groups along an axis of psychopathology severity (HC > BDNP > BDP > SAD > SZ); the S1 P200 response indexed psychosis psychopathology (HC/BDNP > SAD/SZ/BDP); and the preparatory period to the S2 stimulus separated SZ from other groups (SZ > SAD/BDP>HC/BDNP).</p><p>Canonical correlation identified an association between the neural responses during the S1 N100, S1 N200 and S2 preparatory period and PANSS positive symptoms and social functioning. The neural responses during the S1 P50 and S1 N100 were associated with PANSS Negative/General, MADRS and Young Mania symptoms.</p></div><div><h3>Conclusions</h3><p>This study constructively replicated prior B-SNIP1 research on auditory deviations observed during the paired stimuli task in SZ, SAD and BDP. Inclusion of a group of BDNP allows for the identification of biomarkers more closely related to affective versus nonaffective clinical phenotypes and neural distinctions between BDP and BDNP. Findings have implications for nosology and future translational work given that some biomarkers are shared across all psychosis and some are unique to affective syndromes.</p></div>","PeriodicalId":52767,"journal":{"name":"Biomarkers in Neuropsychiatry","volume":null,"pages":null},"PeriodicalIF":0.0000,"publicationDate":"2020-12-01","publicationTypes":"Journal Article","fieldsOfStudy":null,"isOpenAccess":false,"openAccessPdf":"https://sci-hub-pdf.com/10.1016/j.bionps.2020.100014","citationCount":"6","resultStr":null,"platform":"Semanticscholar","paperid":null,"PeriodicalName":"Biomarkers in Neuropsychiatry","FirstCategoryId":"1085","ListUrlMain":"https://www.sciencedirect.com/science/article/pii/S2666144620300046","RegionNum":0,"RegionCategory":null,"ArticlePicture":[],"TitleCN":null,"AbstractTextCN":null,"PMCID":null,"EPubDate":"","PubModel":"","JCR":"Q2","JCRName":"Medicine","Score":null,"Total":0}
引用次数: 6
Abstract
Background
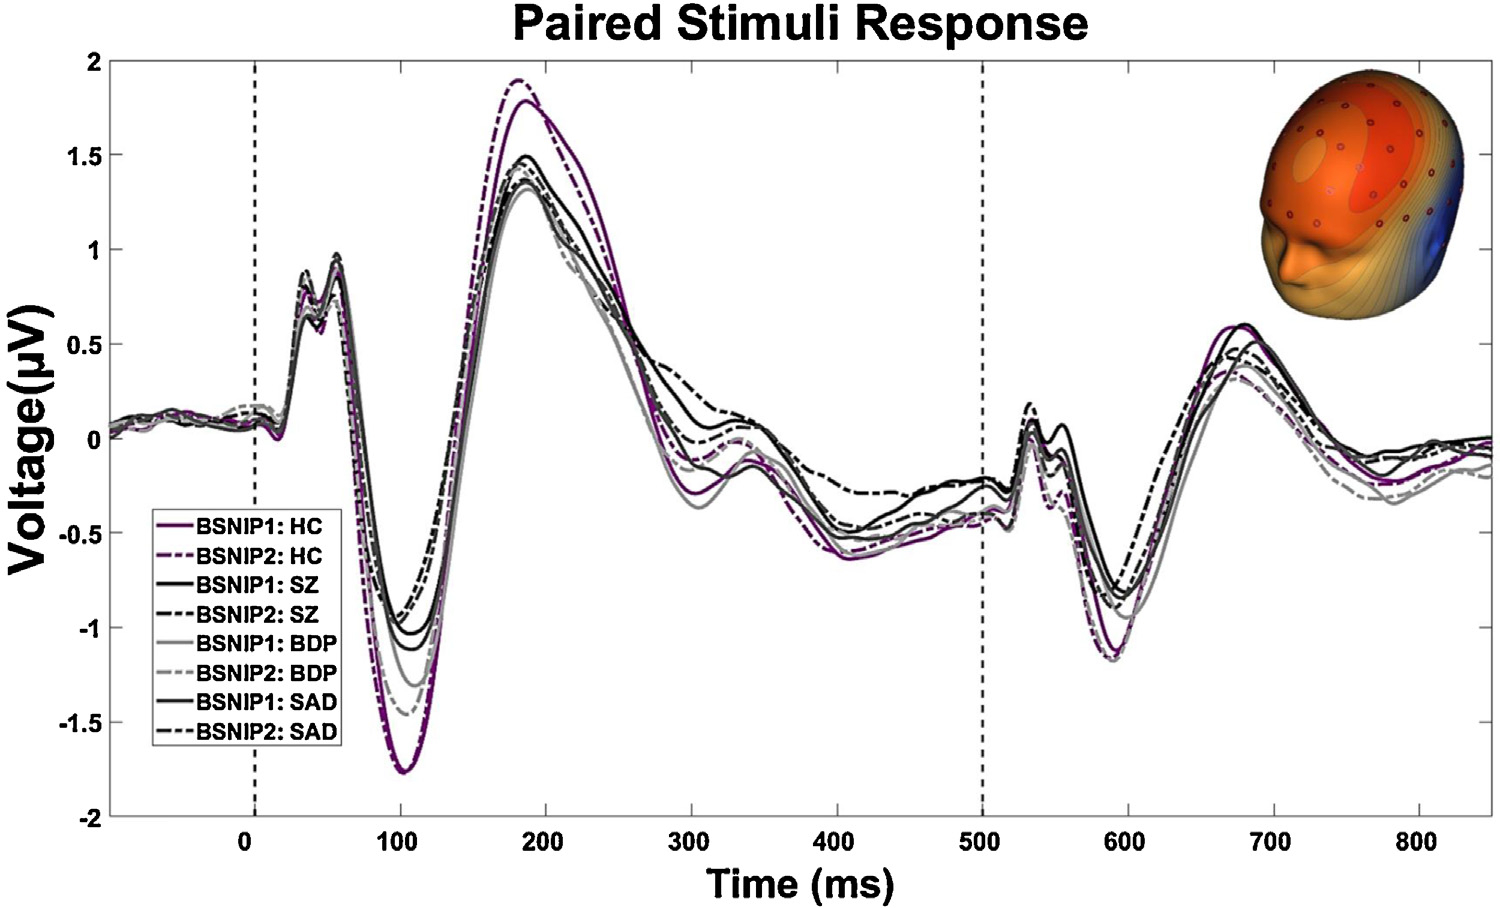
EEG responses during auditory paired-stimuli paradigms are putative biomarkers of psychosis syndromes. The initial iteration of the Bipolar-Schizophrenia Network on Intermediate Phenotypes (B-SNIP1) showed unique and common patterns of abnormalities across schizophrenia (SZ), schizoaffective disorder (SAD), and bipolar disorder with psychosis (BDP). This study replicates those findings in new and large samples of psychosis cases and extends them to an important comparison group, bipolar disorder without psychosis (BDNP).
Methods
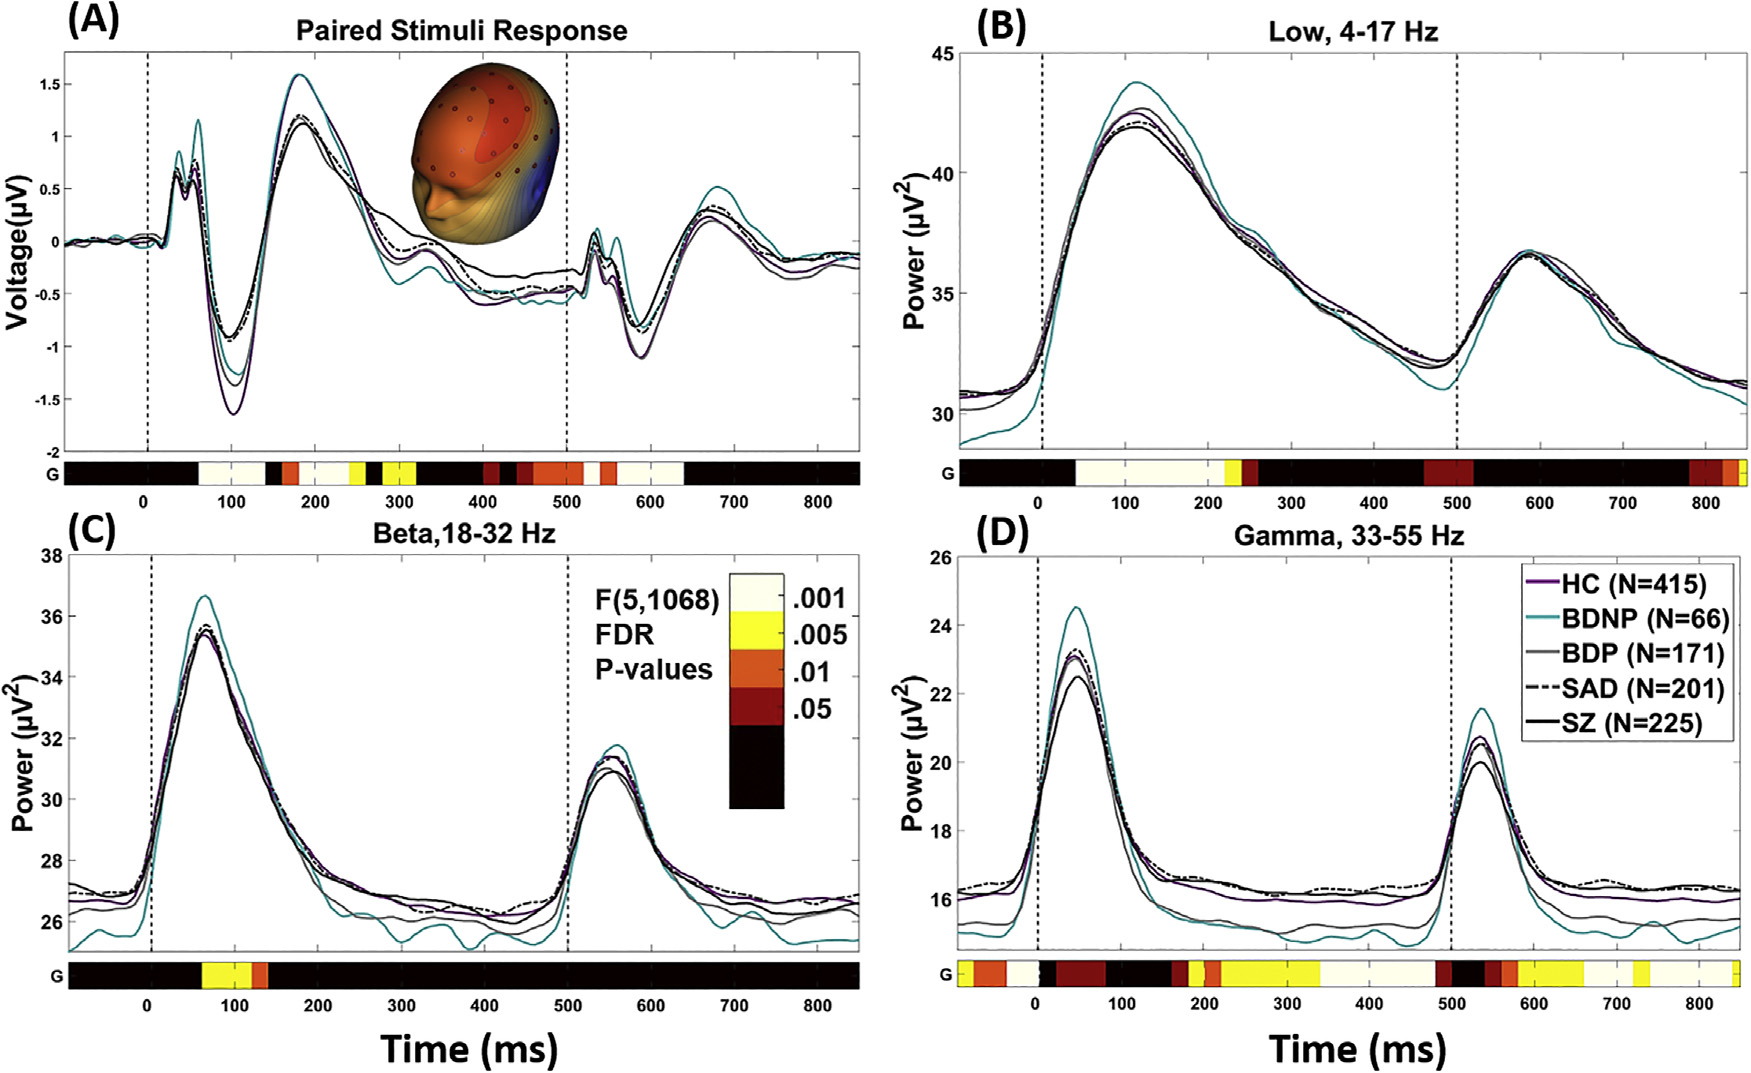
Paired stimuli responses from 64-sensor EEG recording were compared across psychosis (n = 597; SZ = 225, SAD = 201, BDP = 171), BDNP (n = 66), and healthy (n = 415) subjects from the second iteration of B-SNIP. EEG activity was analyzed in voltage and in the time-frequency domain. Principal component analysis (PCA) over sensors (sPCA) was used to efficiently capture EEG voltage responses to the paired stimuli. Evoked power was calculated via a Morlet wavelet procedure. A frequency PCA divided evoked power data into three frequency bands: Low (4−17 Hz), Beta (18−32 Hz), and Gamma (33−55 Hz). Each time-course (ERP Voltage, Low, Beta, and Gamma) were then segmented into 20 ms bins and analyzed for group differences. To efficiently summarize the multiple EEG components that best captured group differences we used multivariate discriminant and correlational analyses. This approach yields a reduced set of measures that may be useful in subsequent biomarker investigations.
Results
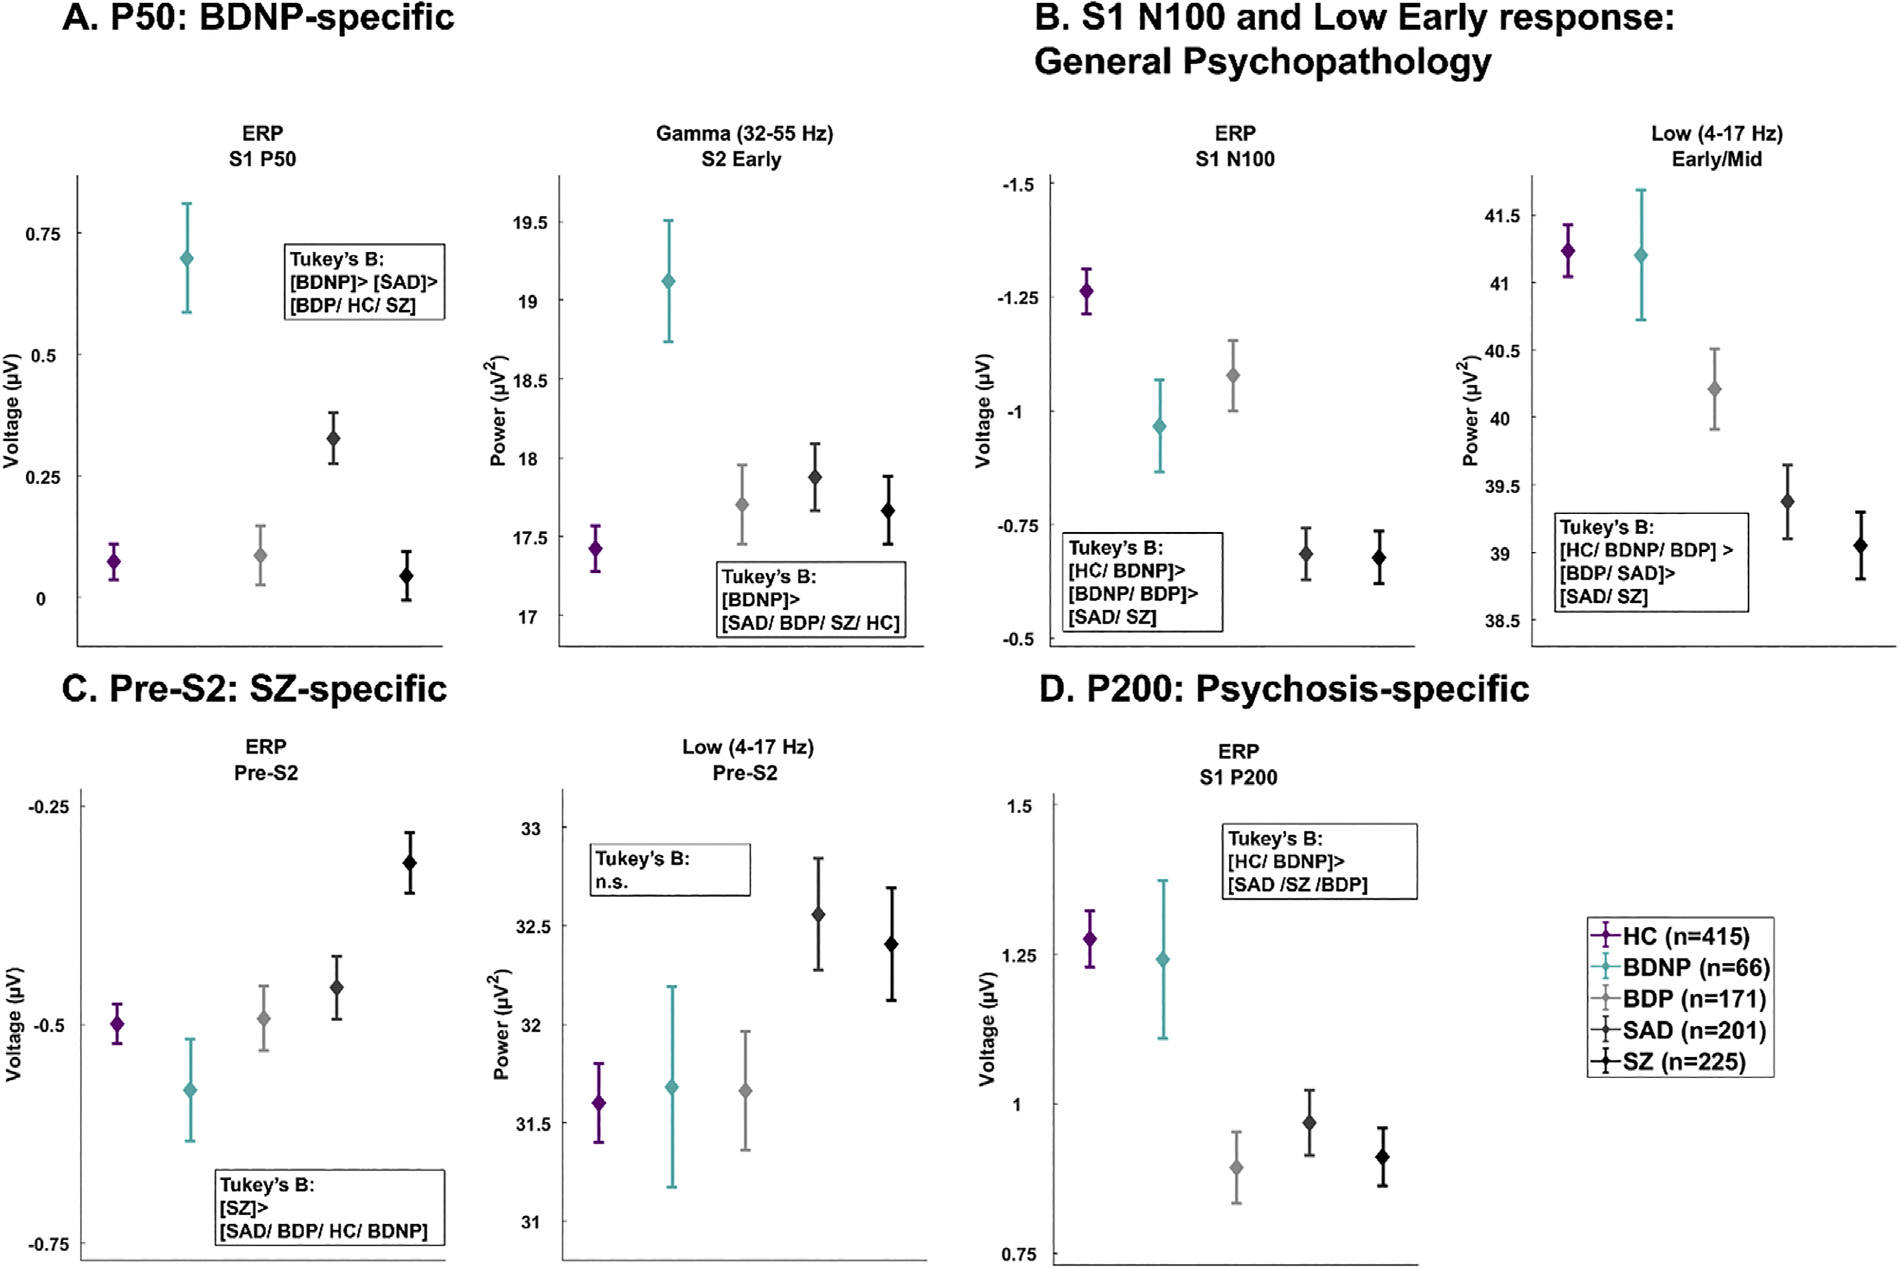
Group ANOVAs identified 17 time-ranges that showed significant group differences (p < .05 after FDR correction), constructively replicating B-SNIP1 findings. Multivariate linear discriminant analysis parsimoniously selected variables that best accounted for group differences: The P50 response to S1 and S2 uniquely separated BDNP from healthy and psychosis subjects (BDNP > all other groups); the S1 N100 response separated groups along an axis of psychopathology severity (HC > BDNP > BDP > SAD > SZ); the S1 P200 response indexed psychosis psychopathology (HC/BDNP > SAD/SZ/BDP); and the preparatory period to the S2 stimulus separated SZ from other groups (SZ > SAD/BDP>HC/BDNP).
Canonical correlation identified an association between the neural responses during the S1 N100, S1 N200 and S2 preparatory period and PANSS positive symptoms and social functioning. The neural responses during the S1 P50 and S1 N100 were associated with PANSS Negative/General, MADRS and Young Mania symptoms.
Conclusions
This study constructively replicated prior B-SNIP1 research on auditory deviations observed during the paired stimuli task in SZ, SAD and BDP. Inclusion of a group of BDNP allows for the identification of biomarkers more closely related to affective versus nonaffective clinical phenotypes and neural distinctions between BDP and BDNP. Findings have implications for nosology and future translational work given that some biomarkers are shared across all psychosis and some are unique to affective syndromes.
 求助内容:
求助内容: 应助结果提醒方式:


