Bedrudin Banjanovic, Ilirijana Haxhibeqiri Karabic, Slavenka Straus, Nermir Granov, Edin Kabil, Malik Jakirlic, Ilijaz Pilav, Muhamed Djedovic
{"title":"Non Invasive Detection of Coronary Sinus Flow Changes Over Time After CABG.","authors":"Bedrudin Banjanovic, Ilirijana Haxhibeqiri Karabic, Slavenka Straus, Nermir Granov, Edin Kabil, Malik Jakirlic, Ilijaz Pilav, Muhamed Djedovic","doi":"10.5455/aim.2022.30.220-224","DOIUrl":null,"url":null,"abstract":"<p><strong>Background: </strong>Coronary New blood in the vascular bed after Coronary Artery Bypass Grafting (CABG) may represent a turning point between ischemia and normal tissue nutrition. Its quantification can help to better understand coronary artery hemodynamics after revascularization.</p><p><strong>Objective: </strong>Quantification of coronary sinus blood flow changes over time after Coronary Artery Bypass Grafting (CABG) using Transthoracic Echocardiography (TTE).</p><p><strong>Methods: </strong>Prospective basic research, with repeated measurements on hospital sample of 61 patients whom CABG was conducted. We performed TTE recordings to measure CS flow before and two times after CABG (1 and 6 postoperative day). We measure CS diameter, Velocity Time Integral (VTI) and systemic hemodynamic data. Data needed for LV mass calculation were recorded once. During statistical analysis we define: α = 0,01, β = 0,01 (power = 1-β β= 0,99), Sample size = 60, Effect size= 0,68. We used ANOVA for Repeated Measures as main statistical test in SPSS.</p><p><strong>Results: </strong>Preoperatively we found low overall CS flow of 181 ±72 ml/min (0,68 ±0,30 ml/gram-LV/min). After surgery there was constant increase of CS flow from 276 ±79 ml/min (1,13 ±0,35 ml/gram-LV/min) first postoperative day, to 355 (±99) ml/min (1,30 ±0,46 ml/gram-LV/min) sixth postoperative day.</p><p><strong>Discussion: </strong>Amount of new blood was statistically significant after CABG with P<0,001. Same result was found after classifying patients per number of graft received, with the highest amount of new blood after four bypasses. Amount of new blood was not different if patient gets two or three bypasses.</p><p><strong>Conclusion: </strong>There was significantly new amount of blood in coronary bed after CABG, with constant increase over first 6 days.</p>","PeriodicalId":7074,"journal":{"name":"Acta Informatica Medica","volume":null,"pages":null},"PeriodicalIF":0.0000,"publicationDate":"2022-09-01","publicationTypes":"Journal Article","fieldsOfStudy":null,"isOpenAccess":false,"openAccessPdf":"https://ftp.ncbi.nlm.nih.gov/pub/pmc/oa_pdf/3a/be/AIM-30-220.PMC9559649.pdf","citationCount":"0","resultStr":null,"platform":"Semanticscholar","paperid":null,"PeriodicalName":"Acta Informatica Medica","FirstCategoryId":"1085","ListUrlMain":"https://doi.org/10.5455/aim.2022.30.220-224","RegionNum":0,"RegionCategory":null,"ArticlePicture":[],"TitleCN":null,"AbstractTextCN":null,"PMCID":null,"EPubDate":"","PubModel":"","JCR":"Q2","JCRName":"Medicine","Score":null,"Total":0}
引用次数: 0
Abstract
Background: Coronary New blood in the vascular bed after Coronary Artery Bypass Grafting (CABG) may represent a turning point between ischemia and normal tissue nutrition. Its quantification can help to better understand coronary artery hemodynamics after revascularization.
Objective: Quantification of coronary sinus blood flow changes over time after Coronary Artery Bypass Grafting (CABG) using Transthoracic Echocardiography (TTE).
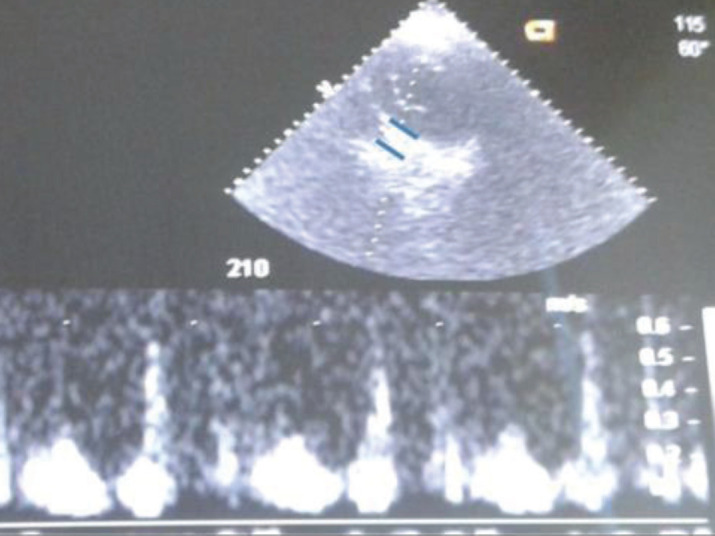
Methods: Prospective basic research, with repeated measurements on hospital sample of 61 patients whom CABG was conducted. We performed TTE recordings to measure CS flow before and two times after CABG (1 and 6 postoperative day). We measure CS diameter, Velocity Time Integral (VTI) and systemic hemodynamic data. Data needed for LV mass calculation were recorded once. During statistical analysis we define: α = 0,01, β = 0,01 (power = 1-β β= 0,99), Sample size = 60, Effect size= 0,68. We used ANOVA for Repeated Measures as main statistical test in SPSS.
Results: Preoperatively we found low overall CS flow of 181 ±72 ml/min (0,68 ±0,30 ml/gram-LV/min). After surgery there was constant increase of CS flow from 276 ±79 ml/min (1,13 ±0,35 ml/gram-LV/min) first postoperative day, to 355 (±99) ml/min (1,30 ±0,46 ml/gram-LV/min) sixth postoperative day.
Discussion: Amount of new blood was statistically significant after CABG with P<0,001. Same result was found after classifying patients per number of graft received, with the highest amount of new blood after four bypasses. Amount of new blood was not different if patient gets two or three bypasses.
Conclusion: There was significantly new amount of blood in coronary bed after CABG, with constant increase over first 6 days.

 求助内容:
求助内容: 应助结果提醒方式:


