Chad A. Steed , John R. Goodall , Junghoon Chae , Artem Trofimov
{"title":"CrossVis:一个可视化分析系统,用于探索异质多元数据,并应用于材料和气候科学","authors":"Chad A. Steed , John R. Goodall , Junghoon Chae , Artem Trofimov","doi":"10.1016/j.gvc.2020.200013","DOIUrl":null,"url":null,"abstract":"<div><p>We present a new visual analytics system, called CrossVis, that allows flexible exploration of multivariate data with heterogeneous data types. After presenting the design requirements, which were derived from prior collaborations with domain experts, we introduce key features of CrossVis beginning with a tabular data model that coordinates multiple linked views and performance enhancements that enable scalable exploration of complex data. Next, we introduce extensions to the parallel coordinates plot, which include new axis representations for numerical, temporal, categorical, and image data, an embedded bivariate axis option, dynamic selections, focus+context axis scaling, and graphical indicators of key statistical values. We demonstrate the practical effectiveness of CrossVis through two scientific use cases; one focused on understanding neural network image classifications from a genetic engineering project and another involving general exploration of a large and complex data set of historical hurricane observations. We conclude with discussions regarding domain expert feedback, future enhancements to address limitations, and the interdisciplinary process used to design CrossVis.</p></div>","PeriodicalId":100592,"journal":{"name":"Graphics and Visual Computing","volume":"3 ","pages":"Article 200013"},"PeriodicalIF":0.0000,"publicationDate":"2020-06-01","publicationTypes":"Journal Article","fieldsOfStudy":null,"isOpenAccess":false,"openAccessPdf":"https://sci-hub-pdf.com/10.1016/j.gvc.2020.200013","citationCount":"11","resultStr":"{\"title\":\"CrossVis: A visual analytics system for exploring heterogeneous multivariate data with applications to materials and climate sciences\",\"authors\":\"Chad A. Steed , John R. Goodall , Junghoon Chae , Artem Trofimov\",\"doi\":\"10.1016/j.gvc.2020.200013\",\"DOIUrl\":null,\"url\":null,\"abstract\":\"<div><p>We present a new visual analytics system, called CrossVis, that allows flexible exploration of multivariate data with heterogeneous data types. After presenting the design requirements, which were derived from prior collaborations with domain experts, we introduce key features of CrossVis beginning with a tabular data model that coordinates multiple linked views and performance enhancements that enable scalable exploration of complex data. Next, we introduce extensions to the parallel coordinates plot, which include new axis representations for numerical, temporal, categorical, and image data, an embedded bivariate axis option, dynamic selections, focus+context axis scaling, and graphical indicators of key statistical values. We demonstrate the practical effectiveness of CrossVis through two scientific use cases; one focused on understanding neural network image classifications from a genetic engineering project and another involving general exploration of a large and complex data set of historical hurricane observations. We conclude with discussions regarding domain expert feedback, future enhancements to address limitations, and the interdisciplinary process used to design CrossVis.</p></div>\",\"PeriodicalId\":100592,\"journal\":{\"name\":\"Graphics and Visual Computing\",\"volume\":\"3 \",\"pages\":\"Article 200013\"},\"PeriodicalIF\":0.0000,\"publicationDate\":\"2020-06-01\",\"publicationTypes\":\"Journal Article\",\"fieldsOfStudy\":null,\"isOpenAccess\":false,\"openAccessPdf\":\"https://sci-hub-pdf.com/10.1016/j.gvc.2020.200013\",\"citationCount\":\"11\",\"resultStr\":null,\"platform\":\"Semanticscholar\",\"paperid\":null,\"PeriodicalName\":\"Graphics and Visual Computing\",\"FirstCategoryId\":\"1085\",\"ListUrlMain\":\"https://www.sciencedirect.com/science/article/pii/S2666629420300012\",\"RegionNum\":0,\"RegionCategory\":null,\"ArticlePicture\":[],\"TitleCN\":null,\"AbstractTextCN\":null,\"PMCID\":null,\"EPubDate\":\"\",\"PubModel\":\"\",\"JCR\":\"\",\"JCRName\":\"\",\"Score\":null,\"Total\":0}","platform":"Semanticscholar","paperid":null,"PeriodicalName":"Graphics and Visual Computing","FirstCategoryId":"1085","ListUrlMain":"https://www.sciencedirect.com/science/article/pii/S2666629420300012","RegionNum":0,"RegionCategory":null,"ArticlePicture":[],"TitleCN":null,"AbstractTextCN":null,"PMCID":null,"EPubDate":"","PubModel":"","JCR":"","JCRName":"","Score":null,"Total":0}
CrossVis: A visual analytics system for exploring heterogeneous multivariate data with applications to materials and climate sciences
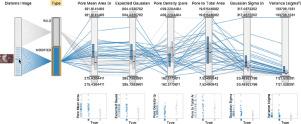
We present a new visual analytics system, called CrossVis, that allows flexible exploration of multivariate data with heterogeneous data types. After presenting the design requirements, which were derived from prior collaborations with domain experts, we introduce key features of CrossVis beginning with a tabular data model that coordinates multiple linked views and performance enhancements that enable scalable exploration of complex data. Next, we introduce extensions to the parallel coordinates plot, which include new axis representations for numerical, temporal, categorical, and image data, an embedded bivariate axis option, dynamic selections, focus+context axis scaling, and graphical indicators of key statistical values. We demonstrate the practical effectiveness of CrossVis through two scientific use cases; one focused on understanding neural network image classifications from a genetic engineering project and another involving general exploration of a large and complex data set of historical hurricane observations. We conclude with discussions regarding domain expert feedback, future enhancements to address limitations, and the interdisciplinary process used to design CrossVis.

 求助内容:
求助内容: 应助结果提醒方式:


