利用R软件制作COVID-19动态交互地图

Chen Shao-ming, Qiu Li, Su Xin-yuan, Jia Pen-ben, Feng Fan-li, Luo Yan, Chen Jing-jing, Lao Shi-jun, Yan Xiu-juan, Qiu Ren, Wang Nan-lai, Jin Yun-ming, He Bin, Chen Yan
{"title":"利用R软件制作COVID-19动态交互地图","authors":"Chen Shao-ming, Qiu Li, Su Xin-yuan, Jia Pen-ben, Feng Fan-li, Luo Yan, Chen Jing-jing, Lao Shi-jun, Yan Xiu-juan, Qiu Ren, Wang Nan-lai, Jin Yun-ming, He Bin, Chen Yan","doi":"10.13604/j.cnki.46-1064/r.2021.05.04","DOIUrl":null,"url":null,"abstract":"Objective To introduce the process and concrete steps of making dynamic interactive disease\n map using Leaflet program package of R software, and we provide assistance for demonstrating\n the regional distribution of the disease, epidemic analysis and field disposal.\n Methods The address, case classification and date of onset of coronavirus disease 2019 (COVID-19)\n cases, including confirmed and asymptomatic cases, in Hainan as of August 30, 2020\n were collected by Infectious Diseases Reporting System. The addresses of cases were\n input into Amap coordinate pickup system to get the latitude and longitude coordinates\n of the addresses. Amap and Esri map were created as base layers, and case markers,\n function for case clusters and measurement tools were created by leaflet package.\n Results Dynamic interactive map of COVID-19 created by R software could be dragged, be zoomed\n in and out. It can be switched between administrative division map and satellite map.\n The numbers, addresses, onset date and other information could be display by clicking\n the cases in the map. The map can be shared with interested researchers as an html\n file. The distance between any cases or between the case and the suspected exposure\n location could be measured.\n Conclusion As a free and open source software, R software can easily and flexibly make dynamic\n interactive maps of diseases, intuitively and comprehensively display the regional\n distribution of diseases. It It plays a very helpful role in analyzing the transmission\n process of infectious diseases and the on-site treatment of the epidemic situation,\n which is worthy of promotion and application in epidemiology investigation and survey\n research.\n 摘要:目的 介绍使用R软件leaflet程序包制作疾病动态交互地图的\n 方法 和具体步骤, 为展示疾病的地区分布、疫 情的分析和现场处置提供帮助。\n 方法 通过传染病信息报告系统收集海南省截至2020年8月30日新型冠状病毒肺炎 确诊病例和无症状感染者地址、病例分类、发病日期等资料。将病例地址录人髙德地图坐标拾取系统,\n 获取病例地址 的经纬度坐标。利用R软件leaflet程序包调用髙德地图、Esri卫星地图做为底图, 添加病例标记, 病例聚合功能及测量 工具。\n 结果 R软件制作的海南省新冠病毒动态交互地图可以实现放大、缩小、拖拽等操作, 可以切换行政区划地图和 卫星地图, 点击病例可以显示病例序号, 现住址和发病日期等信息,\n 可将地图以html文件方式分享给相关研究人员, 并 可以测量病例间或病例与可疑暴露地点间的距离。\n 结论 R软件作为一款免费、开源的软件, 可以简便、灵活的制作 疾病动态交互地图, 直观、全面的展示疾病的地区分布, 对于分析传染病的传播过程、疫情的现场处置起到很好的辅助\n 作用, 在流行病学调査研究中值得推广应用。","PeriodicalId":10045,"journal":{"name":"中国热带医学","volume":"68 1","pages":""},"PeriodicalIF":0.0000,"publicationDate":"2021-05-01","publicationTypes":"Journal Article","fieldsOfStudy":null,"isOpenAccess":false,"openAccessPdf":"","citationCount":"0","resultStr":"{\"title\":\"Making the dynamic interactive map of COVID-19 by implementation of R software\",\"authors\":\"Chen Shao-ming, Qiu Li, Su Xin-yuan, Jia Pen-ben, Feng Fan-li, Luo Yan, Chen Jing-jing, Lao Shi-jun, Yan Xiu-juan, Qiu Ren, Wang Nan-lai, Jin Yun-ming, He Bin, Chen Yan\",\"doi\":\"10.13604/j.cnki.46-1064/r.2021.05.04\",\"DOIUrl\":null,\"url\":null,\"abstract\":\"Objective To introduce the process and concrete steps of making dynamic interactive disease\\n map using Leaflet program package of R software, and we provide assistance for demonstrating\\n the regional distribution of the disease, epidemic analysis and field disposal.\\n Methods The address, case classification and date of onset of coronavirus disease 2019 (COVID-19)\\n cases, including confirmed and asymptomatic cases, in Hainan as of August 30, 2020\\n were collected by Infectious Diseases Reporting System. The addresses of cases were\\n input into Amap coordinate pickup system to get the latitude and longitude coordinates\\n of the addresses. Amap and Esri map were created as base layers, and case markers,\\n function for case clusters and measurement tools were created by leaflet package.\\n Results Dynamic interactive map of COVID-19 created by R software could be dragged, be zoomed\\n in and out. It can be switched between administrative division map and satellite map.\\n The numbers, addresses, onset date and other information could be display by clicking\\n the cases in the map. The map can be shared with interested researchers as an html\\n file. The distance between any cases or between the case and the suspected exposure\\n location could be measured.\\n Conclusion As a free and open source software, R software can easily and flexibly make dynamic\\n interactive maps of diseases, intuitively and comprehensively display the regional\\n distribution of diseases. It It plays a very helpful role in analyzing the transmission\\n process of infectious diseases and the on-site treatment of the epidemic situation,\\n which is worthy of promotion and application in epidemiology investigation and survey\\n research.\\n 摘要:目的 介绍使用R软件leaflet程序包制作疾病动态交互地图的\\n 方法 和具体步骤, 为展示疾病的地区分布、疫 情的分析和现场处置提供帮助。\\n 方法 通过传染病信息报告系统收集海南省截至2020年8月30日新型冠状病毒肺炎 确诊病例和无症状感染者地址、病例分类、发病日期等资料。将病例地址录人髙德地图坐标拾取系统,\\n 获取病例地址 的经纬度坐标。利用R软件leaflet程序包调用髙德地图、Esri卫星地图做为底图, 添加病例标记, 病例聚合功能及测量 工具。\\n 结果 R软件制作的海南省新冠病毒动态交互地图可以实现放大、缩小、拖拽等操作, 可以切换行政区划地图和 卫星地图, 点击病例可以显示病例序号, 现住址和发病日期等信息,\\n 可将地图以html文件方式分享给相关研究人员, 并 可以测量病例间或病例与可疑暴露地点间的距离。\\n 结论 R软件作为一款免费、开源的软件, 可以简便、灵活的制作 疾病动态交互地图, 直观、全面的展示疾病的地区分布, 对于分析传染病的传播过程、疫情的现场处置起到很好的辅助\\n 作用, 在流行病学调査研究中值得推广应用。\",\"PeriodicalId\":10045,\"journal\":{\"name\":\"中国热带医学\",\"volume\":\"68 1\",\"pages\":\"\"},\"PeriodicalIF\":0.0000,\"publicationDate\":\"2021-05-01\",\"publicationTypes\":\"Journal Article\",\"fieldsOfStudy\":null,\"isOpenAccess\":false,\"openAccessPdf\":\"\",\"citationCount\":\"0\",\"resultStr\":null,\"platform\":\"Semanticscholar\",\"paperid\":null,\"PeriodicalName\":\"中国热带医学\",\"FirstCategoryId\":\"3\",\"ListUrlMain\":\"https://doi.org/10.13604/j.cnki.46-1064/r.2021.05.04\",\"RegionNum\":0,\"RegionCategory\":null,\"ArticlePicture\":[],\"TitleCN\":null,\"AbstractTextCN\":null,\"PMCID\":null,\"EPubDate\":\"\",\"PubModel\":\"\",\"JCR\":\"\",\"JCRName\":\"\",\"Score\":null,\"Total\":0}","platform":"Semanticscholar","paperid":null,"PeriodicalName":"中国热带医学","FirstCategoryId":"3","ListUrlMain":"https://doi.org/10.13604/j.cnki.46-1064/r.2021.05.04","RegionNum":0,"RegionCategory":null,"ArticlePicture":[],"TitleCN":null,"AbstractTextCN":null,"PMCID":null,"EPubDate":"","PubModel":"","JCR":"","JCRName":"","Score":null,"Total":0}
引用次数: 0

摘要

目的介绍利用R软件的传单程序包制作动态交互式疾病地图的过程和具体步骤,为展示疾病的区域分布、流行分析和现场处置提供帮助。方法通过传染病报告系统收集海南省截至2020年8月30日的2019冠状病毒病(COVID-19)病例地址、病例分类和发病日期,包括确诊病例和无症状病例。将案件地址输入高德地图坐标提取系统,获取案件地址的经纬度坐标。地图和Esri地图作为基础层,案例标记、案例聚类功能和测量工具通过传单包创建。结果采用R软件制作的新型冠状病毒动态交互地图可进行拖动、放大和缩小。可以在行政区划图和卫星图之间切换。通过点击地图上的病例,可以显示号码、地址、发病日期和其他信息。该地图可以作为html文件与感兴趣的研究人员共享。可以测量任何病例之间或病例与疑似接触地点之间的距离。R软件作为一款免费开源的软件,可以方便灵活地制作动态交互式疾病地图,直观全面地展示疾病的区域分布。它对传染病的传播过程分析和疫情的现场处理具有非常有益的作用,值得在流行病学调查和调查研究中推广应用。摘要:目的介绍使用R软件传单程序包制作疾病动态交互地图的方法和具体步骤,为展示疾病的地区分布,疫情的分析和现场处置提供帮助。方法 通过传染病信息报告系统收集海南省截至2020年8月30日新型冠状病毒肺炎 确诊病例和无症状感染者地址、病例分类、发病日期等资料。将病例地址录人髙德地图坐标拾取系统, 获取病例地址 的经纬度坐标。利用R软件传单程序包调用髙德地图,Esri卫星地图做为底图,添加病例标记,病例聚合功能及测量工具。结果R软件制作的海南省新冠病毒动态交互地图可以实现放大,缩小,拖拽等操作,可以切换行政区划地图和卫星地图,点击病例可以显示病例序号,现住址和发病日期等信息,可将地图以html文件方式分享给相关研究人员,并可以测量病例间或病例与可疑暴露地点间的距离。结论R软件作为一款免费,开源的软件,可以简便,灵活的制作疾病动态交互地图,直观,全面的展示疾病的地区分布,对于分析传染病的传播过程,疫情的现场处置起到很好的辅助作用,在流行病学调査研究中值得推广应用。
本文章由计算机程序翻译,如有差异,请以英文原文为准。
Making the dynamic interactive map of COVID-19 by implementation of R software
Objective To introduce the process and concrete steps of making dynamic interactive disease map using Leaflet program package of R software, and we provide assistance for demonstrating the regional distribution of the disease, epidemic analysis and field disposal. Methods The address, case classification and date of onset of coronavirus disease 2019 (COVID-19) cases, including confirmed and asymptomatic cases, in Hainan as of August 30, 2020 were collected by Infectious Diseases Reporting System. The addresses of cases were input into Amap coordinate pickup system to get the latitude and longitude coordinates of the addresses. Amap and Esri map were created as base layers, and case markers, function for case clusters and measurement tools were created by leaflet package. Results Dynamic interactive map of COVID-19 created by R software could be dragged, be zoomed in and out. It can be switched between administrative division map and satellite map. The numbers, addresses, onset date and other information could be display by clicking the cases in the map. The map can be shared with interested researchers as an html file. The distance between any cases or between the case and the suspected exposure location could be measured. Conclusion As a free and open source software, R software can easily and flexibly make dynamic interactive maps of diseases, intuitively and comprehensively display the regional distribution of diseases. It It plays a very helpful role in analyzing the transmission process of infectious diseases and the on-site treatment of the epidemic situation, which is worthy of promotion and application in epidemiology investigation and survey research. 摘要:目的 介绍使用R软件leaflet程序包制作疾病动态交互地图的 方法 和具体步骤, 为展示疾病的地区分布、疫 情的分析和现场处置提供帮助。 方法 通过传染病信息报告系统收集海南省截至2020年8月30日新型冠状病毒肺炎 确诊病例和无症状感染者地址、病例分类、发病日期等资料。将病例地址录人髙德地图坐标拾取系统, 获取病例地址 的经纬度坐标。利用R软件leaflet程序包调用髙德地图、Esri卫星地图做为底图, 添加病例标记, 病例聚合功能及测量 工具。 结果 R软件制作的海南省新冠病毒动态交互地图可以实现放大、缩小、拖拽等操作, 可以切换行政区划地图和 卫星地图, 点击病例可以显示病例序号, 现住址和发病日期等信息, 可将地图以html文件方式分享给相关研究人员, 并 可以测量病例间或病例与可疑暴露地点间的距离。 结论 R软件作为一款免费、开源的软件, 可以简便、灵活的制作 疾病动态交互地图, 直观、全面的展示疾病的地区分布, 对于分析传染病的传播过程、疫情的现场处置起到很好的辅助 作用, 在流行病学调査研究中值得推广应用。
求助全文
通过发布文献求助,成功后即可免费获取论文全文。 去求助
来源期刊
CiteScore
0.60
自引率
0.00%
发文量
13927
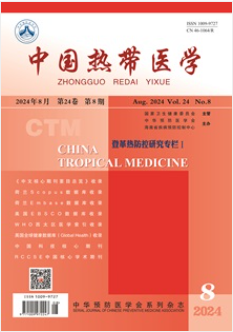
期刊介绍: China Tropical Medicine, was approved by the Ministry of Science and Technology in 2001, is the only tropical medicine periodical under the charge of the National Health Commission of China. It’s organized by Hainan Provincial Center for Disease Prevention and Control, and Chinese Preventive Medicine Association. The journal is indexed by the following database: Scopus database, Embase database, EBSCO Database, The Western Pacific Region index medicus (WPRIM), American Chemical Abstracts (CA), International Centre for Agricultural and Biological Sciences Research Database (CABI), Global Health Database, Database of the Ulrich's Periodicals Directory, China Science and Technology Core Journals, China Core Journals (Selection) Database, Database of Chinese Biomedical Literature, Comprehensive Evaluation Database of Chinese Academic Journals, CAJCD Code of Conduct Excellent Journal, Database of Chinese SCI-Tech Periodicals, China Journal Full Text Database.
×
引用
GB/T 7714-2015
复制
MLA
复制
APA
复制
导出至
BibTeX EndNote RefMan NoteFirst NoteExpress
×
提示
您的信息不完整,为了账户安全,请先补充。
现在去补充
×
提示
您因"违规操作"
具体请查看互助需知
我知道了
×
提示
确定
请完成安全验证×
copy
已复制链接
快去分享给好友吧!
我知道了
右上角分享
点击右上角分享
0
联系我们:info@booksci.cn Book学术提供免费学术资源搜索服务,方便国内外学者检索中英文文献。致力于提供最便捷和优质的服务体验。 Copyright © 2023 布克学术 All rights reserved.
京ICP备2023020795号-1
ghs 京公网安备 11010802042870号
Book学术文献互助
Book学术文献互助群
群 号:481959085
Book学术官方微信