Wolfgang Gaissmaier, Kevin E Tiede, Rocio Garcia-Retamero
{"title":"美的诱惑:人们选择统计信息的表现主要基于吸引力,而不是可理解性。","authors":"Wolfgang Gaissmaier, Kevin E Tiede, Rocio Garcia-Retamero","doi":"10.1177/0272989X231201579","DOIUrl":null,"url":null,"abstract":"<p><strong>Objective: </strong>People differ in whether they understand graphical or numerical representations of statistical information better. However, assessing these skills is often not feasible when deciding which representation to select or use. This study investigates whether people choose the representation they understand better, whether this choice can improve risk comprehension, and whether results are influenced by participants' skills (graph literacy and numeracy).</p><p><strong>Methods: </strong>In an experiment, 160 participants received information about the benefits and side effects of painkillers using either a numerical or a graphical representation. In the \"no choice\" condition, the representation was randomly assigned to each participant. In the \"choice\" condition, participants could select the representation they would like to receive. The study assessed gist and verbatim knowledge (immediate comprehension and recall), accessibility of the information, attractiveness of the representation, as well as graph literacy and numeracy.</p><p><strong>Results: </strong>In the \"choice\" condition, most (62.5%) chose the graphical format, yet there was no difference in graph literacy or numeracy (nor age or gender) between people who chose the graphical or the numerical format. Whereas choice slightly increased verbatim knowledge, it did not improve gist or overall knowledge compared with random assignment. However, participants who chose a representation rated the representation as more attractive, and those who chose graphs rated them as more accessible than those without a choice.</p><p><strong>Limitations: </strong>The sample consisted of highly educated undergraduate students with higher graph literacy than the general population. The task was inconsequential for participants in terms of their health.</p><p><strong>Conclusions: </strong>When people can choose between representations, they fail to identify what they comprehend better but largely base that choice on how attractive the representation is for them.</p><p><strong>Highlights: </strong>People differ systematically in whether they understand graphical or numerical representations of statistical information better. However, assessing these underlying skills to get the right representation to the right people is not feasible in practice. A simple and efficient method to achieve this could be to let people choose among representations themselves.However, our study showed that allowing participants to choose a representation (numerical v. graphical) did not improve overall or gist knowledge compared with determining the representation randomly, even though it did slightly improve verbatim knowledge.Rather, participants largely chose the representation they found more attractive. Most preferred the graphical representation, including those with low graph literacy.It would therefore be important to develop graphical representations that are not only attractive but also comprehensible even for people with low graph literacy.</p>","PeriodicalId":49839,"journal":{"name":"Medical Decision Making","volume":null,"pages":null},"PeriodicalIF":3.1000,"publicationDate":"2023-10-01","publicationTypes":"Journal Article","fieldsOfStudy":null,"isOpenAccess":false,"openAccessPdf":"https://www.ncbi.nlm.nih.gov/pmc/articles/PMC10625725/pdf/","citationCount":"0","resultStr":"{\"title\":\"The Lure of Beauty: People Select Representations of Statistical Information Largely Based on Attractiveness, Not Comprehensibility.\",\"authors\":\"Wolfgang Gaissmaier, Kevin E Tiede, Rocio Garcia-Retamero\",\"doi\":\"10.1177/0272989X231201579\",\"DOIUrl\":null,\"url\":null,\"abstract\":\"<p><strong>Objective: </strong>People differ in whether they understand graphical or numerical representations of statistical information better. However, assessing these skills is often not feasible when deciding which representation to select or use. This study investigates whether people choose the representation they understand better, whether this choice can improve risk comprehension, and whether results are influenced by participants' skills (graph literacy and numeracy).</p><p><strong>Methods: </strong>In an experiment, 160 participants received information about the benefits and side effects of painkillers using either a numerical or a graphical representation. In the \\\"no choice\\\" condition, the representation was randomly assigned to each participant. In the \\\"choice\\\" condition, participants could select the representation they would like to receive. The study assessed gist and verbatim knowledge (immediate comprehension and recall), accessibility of the information, attractiveness of the representation, as well as graph literacy and numeracy.</p><p><strong>Results: </strong>In the \\\"choice\\\" condition, most (62.5%) chose the graphical format, yet there was no difference in graph literacy or numeracy (nor age or gender) between people who chose the graphical or the numerical format. Whereas choice slightly increased verbatim knowledge, it did not improve gist or overall knowledge compared with random assignment. However, participants who chose a representation rated the representation as more attractive, and those who chose graphs rated them as more accessible than those without a choice.</p><p><strong>Limitations: </strong>The sample consisted of highly educated undergraduate students with higher graph literacy than the general population. The task was inconsequential for participants in terms of their health.</p><p><strong>Conclusions: </strong>When people can choose between representations, they fail to identify what they comprehend better but largely base that choice on how attractive the representation is for them.</p><p><strong>Highlights: </strong>People differ systematically in whether they understand graphical or numerical representations of statistical information better. However, assessing these underlying skills to get the right representation to the right people is not feasible in practice. A simple and efficient method to achieve this could be to let people choose among representations themselves.However, our study showed that allowing participants to choose a representation (numerical v. graphical) did not improve overall or gist knowledge compared with determining the representation randomly, even though it did slightly improve verbatim knowledge.Rather, participants largely chose the representation they found more attractive. Most preferred the graphical representation, including those with low graph literacy.It would therefore be important to develop graphical representations that are not only attractive but also comprehensible even for people with low graph literacy.</p>\",\"PeriodicalId\":49839,\"journal\":{\"name\":\"Medical Decision Making\",\"volume\":null,\"pages\":null},\"PeriodicalIF\":3.1000,\"publicationDate\":\"2023-10-01\",\"publicationTypes\":\"Journal Article\",\"fieldsOfStudy\":null,\"isOpenAccess\":false,\"openAccessPdf\":\"https://www.ncbi.nlm.nih.gov/pmc/articles/PMC10625725/pdf/\",\"citationCount\":\"0\",\"resultStr\":null,\"platform\":\"Semanticscholar\",\"paperid\":null,\"PeriodicalName\":\"Medical Decision Making\",\"FirstCategoryId\":\"3\",\"ListUrlMain\":\"https://doi.org/10.1177/0272989X231201579\",\"RegionNum\":3,\"RegionCategory\":\"医学\",\"ArticlePicture\":[],\"TitleCN\":null,\"AbstractTextCN\":null,\"PMCID\":null,\"EPubDate\":\"2023/10/23 0:00:00\",\"PubModel\":\"Epub\",\"JCR\":\"Q2\",\"JCRName\":\"HEALTH CARE SCIENCES & SERVICES\",\"Score\":null,\"Total\":0}","platform":"Semanticscholar","paperid":null,"PeriodicalName":"Medical Decision Making","FirstCategoryId":"3","ListUrlMain":"https://doi.org/10.1177/0272989X231201579","RegionNum":3,"RegionCategory":"医学","ArticlePicture":[],"TitleCN":null,"AbstractTextCN":null,"PMCID":null,"EPubDate":"2023/10/23 0:00:00","PubModel":"Epub","JCR":"Q2","JCRName":"HEALTH CARE SCIENCES & SERVICES","Score":null,"Total":0}
The Lure of Beauty: People Select Representations of Statistical Information Largely Based on Attractiveness, Not Comprehensibility.
Objective: People differ in whether they understand graphical or numerical representations of statistical information better. However, assessing these skills is often not feasible when deciding which representation to select or use. This study investigates whether people choose the representation they understand better, whether this choice can improve risk comprehension, and whether results are influenced by participants' skills (graph literacy and numeracy).
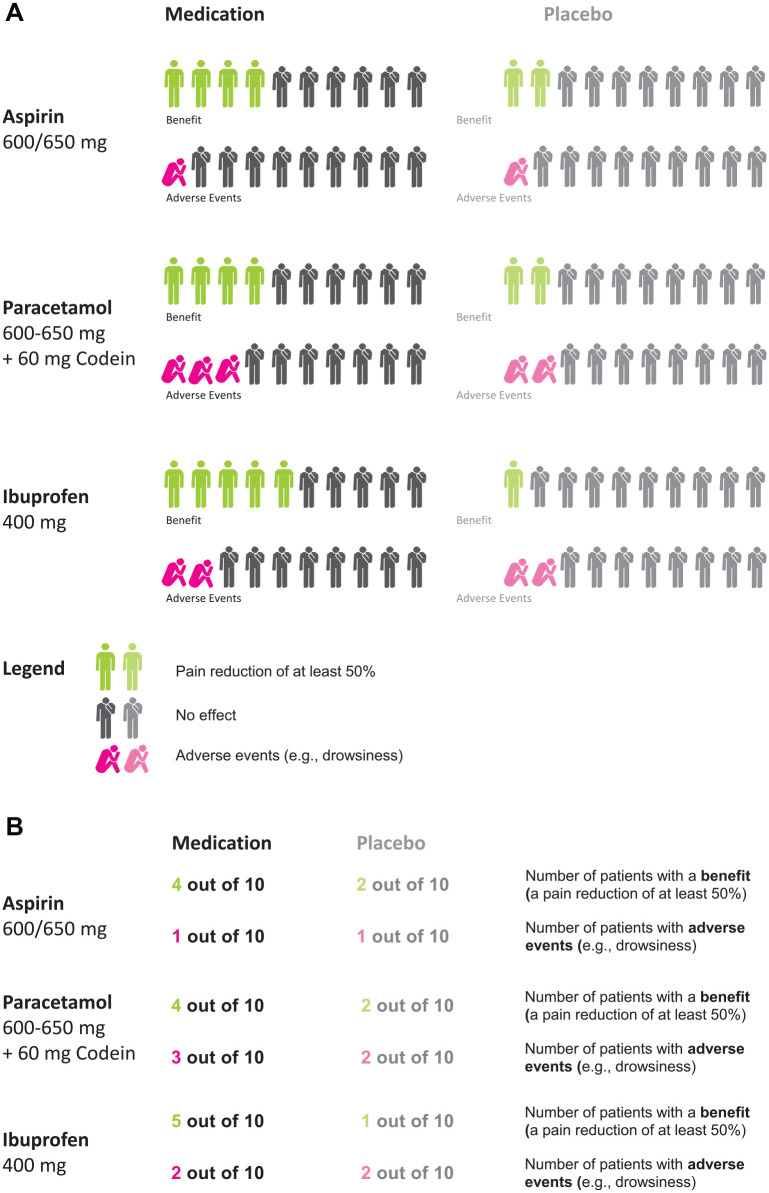
Methods: In an experiment, 160 participants received information about the benefits and side effects of painkillers using either a numerical or a graphical representation. In the "no choice" condition, the representation was randomly assigned to each participant. In the "choice" condition, participants could select the representation they would like to receive. The study assessed gist and verbatim knowledge (immediate comprehension and recall), accessibility of the information, attractiveness of the representation, as well as graph literacy and numeracy.
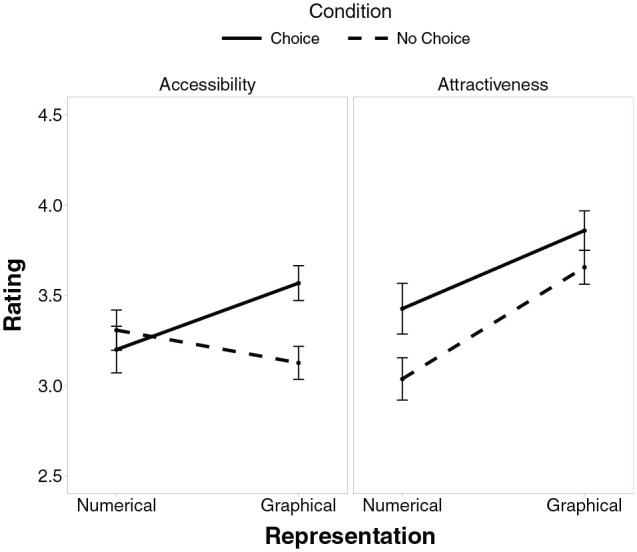
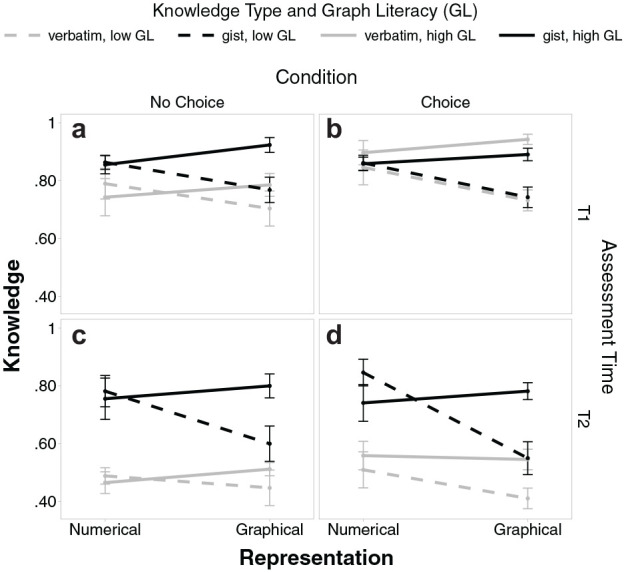
Results: In the "choice" condition, most (62.5%) chose the graphical format, yet there was no difference in graph literacy or numeracy (nor age or gender) between people who chose the graphical or the numerical format. Whereas choice slightly increased verbatim knowledge, it did not improve gist or overall knowledge compared with random assignment. However, participants who chose a representation rated the representation as more attractive, and those who chose graphs rated them as more accessible than those without a choice.
Limitations: The sample consisted of highly educated undergraduate students with higher graph literacy than the general population. The task was inconsequential for participants in terms of their health.
Conclusions: When people can choose between representations, they fail to identify what they comprehend better but largely base that choice on how attractive the representation is for them.
Highlights: People differ systematically in whether they understand graphical or numerical representations of statistical information better. However, assessing these underlying skills to get the right representation to the right people is not feasible in practice. A simple and efficient method to achieve this could be to let people choose among representations themselves.However, our study showed that allowing participants to choose a representation (numerical v. graphical) did not improve overall or gist knowledge compared with determining the representation randomly, even though it did slightly improve verbatim knowledge.Rather, participants largely chose the representation they found more attractive. Most preferred the graphical representation, including those with low graph literacy.It would therefore be important to develop graphical representations that are not only attractive but also comprehensible even for people with low graph literacy.
期刊介绍:
Medical Decision Making offers rigorous and systematic approaches to decision making that are designed to improve the health and clinical care of individuals and to assist with health care policy development. Using the fundamentals of decision analysis and theory, economic evaluation, and evidence based quality assessment, Medical Decision Making presents both theoretical and practical statistical and modeling techniques and methods from a variety of disciplines.
 求助内容:
求助内容: 应助结果提醒方式:


