Aroon D Hingorani, Jasmine Gratton, Chris Finan, A Floriaan Schmidt, Riyaz Patel, Reecha Sofat, Valerie Kuan, Claudia Langenberg, Harry Hemingway, Joan K Morris, Nicholas J Wald
{"title":"多基因风险评分在筛查、预测和风险分层中的表现:多基因评分目录中数据的二次分析。","authors":"Aroon D Hingorani, Jasmine Gratton, Chris Finan, A Floriaan Schmidt, Riyaz Patel, Reecha Sofat, Valerie Kuan, Claudia Langenberg, Harry Hemingway, Joan K Morris, Nicholas J Wald","doi":"10.1136/bmjmed-2023-000554","DOIUrl":null,"url":null,"abstract":"<p><strong>Objective: </strong>To clarify the performance of polygenic risk scores in population screening, individual risk prediction, and population risk stratification.</p><p><strong>Design: </strong>Secondary analysis of data in the Polygenic Score Catalog.</p><p><strong>Setting: </strong>Polygenic Score Catalog, April 2022. Secondary analysis of 3915 performance metric estimates for 926 polygenic risk scores for 310 diseases to generate estimates of performance in population screening, individual risk, and population risk stratification.</p><p><strong>Participants: </strong>Individuals contributing to the published studies in the Polygenic Score Catalog.</p><p><strong>Main outcome measures: </strong>Detection rate for a 5% false positive rate (DR<sub>5</sub>) and the population odds of becoming affected given a positive result; individual odds of becoming affected for a person with a particular polygenic score; and odds of becoming affected for groups of individuals in different portions of a polygenic risk score distribution. Coronary artery disease and breast cancer were used as illustrative examples.</p><p><strong>Results: </strong>For performance in population screening, median DR<sub>5</sub> for all polygenic risk scores and all diseases studied was 11% (interquartile range 8-18%). Median DR<sub>5</sub> was 12% (9-19%) for polygenic risk scores for coronary artery disease and 10% (9-12%) for breast cancer. The population odds of becoming affected given a positive results were 1:8 for coronary artery disease and 1:21 for breast cancer, with background 10 year odds of 1:19 and 1:41, respectively, which are typical for these diseases at age 50. For individual risk prediction, the corresponding 10 year odds of becoming affected for individuals aged 50 with a polygenic risk score at the 2.5th, 25th, 75th, and 97.5th centiles were 1:54, 1:29, 1:15, and 1:8 for coronary artery disease and 1:91, 1:56, 1:34, and 1:21 for breast cancer. In terms of population risk stratification, at age 50, the risk of coronary artery disease was divided into five groups, with 10 year odds of 1:41 and 1:11 for the lowest and highest quintile groups, respectively. The 10 year odds was 1:7 for the upper 2.5% of the polygenic risk score distribution for coronary artery disease, a group that contributed 7% of cases. The corresponding estimates for breast cancer were 1:72 and 1:26 for the lowest and highest quintile groups, and 1:19 for the upper 2.5% of the distribution, which contributed 6% of cases.</p><p><strong>Conclusion: </strong>Polygenic risk scores performed poorly in population screening, individual risk prediction, and population risk stratification. Strong claims about the effect of polygenic risk scores on healthcare seem to be disproportionate to their performance.</p>","PeriodicalId":72433,"journal":{"name":"BMJ medicine","volume":"2 1","pages":"e000554"},"PeriodicalIF":10.0000,"publicationDate":"2023-10-17","publicationTypes":"Journal Article","fieldsOfStudy":null,"isOpenAccess":false,"openAccessPdf":"https://www.ncbi.nlm.nih.gov/pmc/articles/PMC10582890/pdf/","citationCount":"0","resultStr":"{\"title\":\"Performance of polygenic risk scores in screening, prediction, and risk stratification: secondary analysis of data in the Polygenic Score Catalog.\",\"authors\":\"Aroon D Hingorani, Jasmine Gratton, Chris Finan, A Floriaan Schmidt, Riyaz Patel, Reecha Sofat, Valerie Kuan, Claudia Langenberg, Harry Hemingway, Joan K Morris, Nicholas J Wald\",\"doi\":\"10.1136/bmjmed-2023-000554\",\"DOIUrl\":null,\"url\":null,\"abstract\":\"<p><strong>Objective: </strong>To clarify the performance of polygenic risk scores in population screening, individual risk prediction, and population risk stratification.</p><p><strong>Design: </strong>Secondary analysis of data in the Polygenic Score Catalog.</p><p><strong>Setting: </strong>Polygenic Score Catalog, April 2022. Secondary analysis of 3915 performance metric estimates for 926 polygenic risk scores for 310 diseases to generate estimates of performance in population screening, individual risk, and population risk stratification.</p><p><strong>Participants: </strong>Individuals contributing to the published studies in the Polygenic Score Catalog.</p><p><strong>Main outcome measures: </strong>Detection rate for a 5% false positive rate (DR<sub>5</sub>) and the population odds of becoming affected given a positive result; individual odds of becoming affected for a person with a particular polygenic score; and odds of becoming affected for groups of individuals in different portions of a polygenic risk score distribution. Coronary artery disease and breast cancer were used as illustrative examples.</p><p><strong>Results: </strong>For performance in population screening, median DR<sub>5</sub> for all polygenic risk scores and all diseases studied was 11% (interquartile range 8-18%). Median DR<sub>5</sub> was 12% (9-19%) for polygenic risk scores for coronary artery disease and 10% (9-12%) for breast cancer. The population odds of becoming affected given a positive results were 1:8 for coronary artery disease and 1:21 for breast cancer, with background 10 year odds of 1:19 and 1:41, respectively, which are typical for these diseases at age 50. For individual risk prediction, the corresponding 10 year odds of becoming affected for individuals aged 50 with a polygenic risk score at the 2.5th, 25th, 75th, and 97.5th centiles were 1:54, 1:29, 1:15, and 1:8 for coronary artery disease and 1:91, 1:56, 1:34, and 1:21 for breast cancer. In terms of population risk stratification, at age 50, the risk of coronary artery disease was divided into five groups, with 10 year odds of 1:41 and 1:11 for the lowest and highest quintile groups, respectively. The 10 year odds was 1:7 for the upper 2.5% of the polygenic risk score distribution for coronary artery disease, a group that contributed 7% of cases. The corresponding estimates for breast cancer were 1:72 and 1:26 for the lowest and highest quintile groups, and 1:19 for the upper 2.5% of the distribution, which contributed 6% of cases.</p><p><strong>Conclusion: </strong>Polygenic risk scores performed poorly in population screening, individual risk prediction, and population risk stratification. Strong claims about the effect of polygenic risk scores on healthcare seem to be disproportionate to their performance.</p>\",\"PeriodicalId\":72433,\"journal\":{\"name\":\"BMJ medicine\",\"volume\":\"2 1\",\"pages\":\"e000554\"},\"PeriodicalIF\":10.0000,\"publicationDate\":\"2023-10-17\",\"publicationTypes\":\"Journal Article\",\"fieldsOfStudy\":null,\"isOpenAccess\":false,\"openAccessPdf\":\"https://www.ncbi.nlm.nih.gov/pmc/articles/PMC10582890/pdf/\",\"citationCount\":\"0\",\"resultStr\":null,\"platform\":\"Semanticscholar\",\"paperid\":null,\"PeriodicalName\":\"BMJ medicine\",\"FirstCategoryId\":\"1085\",\"ListUrlMain\":\"https://doi.org/10.1136/bmjmed-2023-000554\",\"RegionNum\":0,\"RegionCategory\":null,\"ArticlePicture\":[],\"TitleCN\":null,\"AbstractTextCN\":null,\"PMCID\":null,\"EPubDate\":\"2023/1/1 0:00:00\",\"PubModel\":\"eCollection\",\"JCR\":\"\",\"JCRName\":\"\",\"Score\":null,\"Total\":0}","platform":"Semanticscholar","paperid":null,"PeriodicalName":"BMJ medicine","FirstCategoryId":"1085","ListUrlMain":"https://doi.org/10.1136/bmjmed-2023-000554","RegionNum":0,"RegionCategory":null,"ArticlePicture":[],"TitleCN":null,"AbstractTextCN":null,"PMCID":null,"EPubDate":"2023/1/1 0:00:00","PubModel":"eCollection","JCR":"","JCRName":"","Score":null,"Total":0}
Performance of polygenic risk scores in screening, prediction, and risk stratification: secondary analysis of data in the Polygenic Score Catalog.
Objective: To clarify the performance of polygenic risk scores in population screening, individual risk prediction, and population risk stratification.
Design: Secondary analysis of data in the Polygenic Score Catalog.
Setting: Polygenic Score Catalog, April 2022. Secondary analysis of 3915 performance metric estimates for 926 polygenic risk scores for 310 diseases to generate estimates of performance in population screening, individual risk, and population risk stratification.
Participants: Individuals contributing to the published studies in the Polygenic Score Catalog.
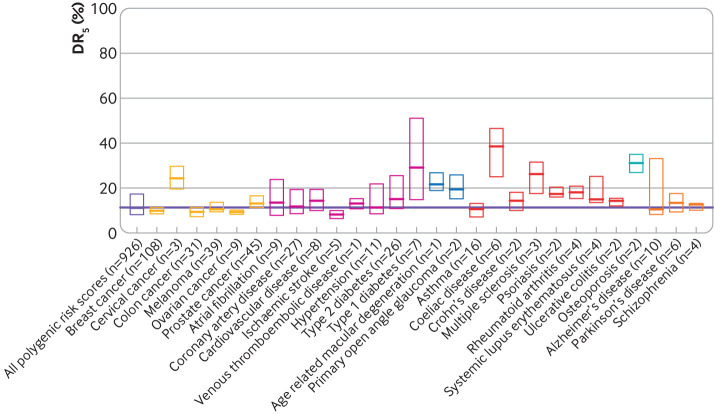
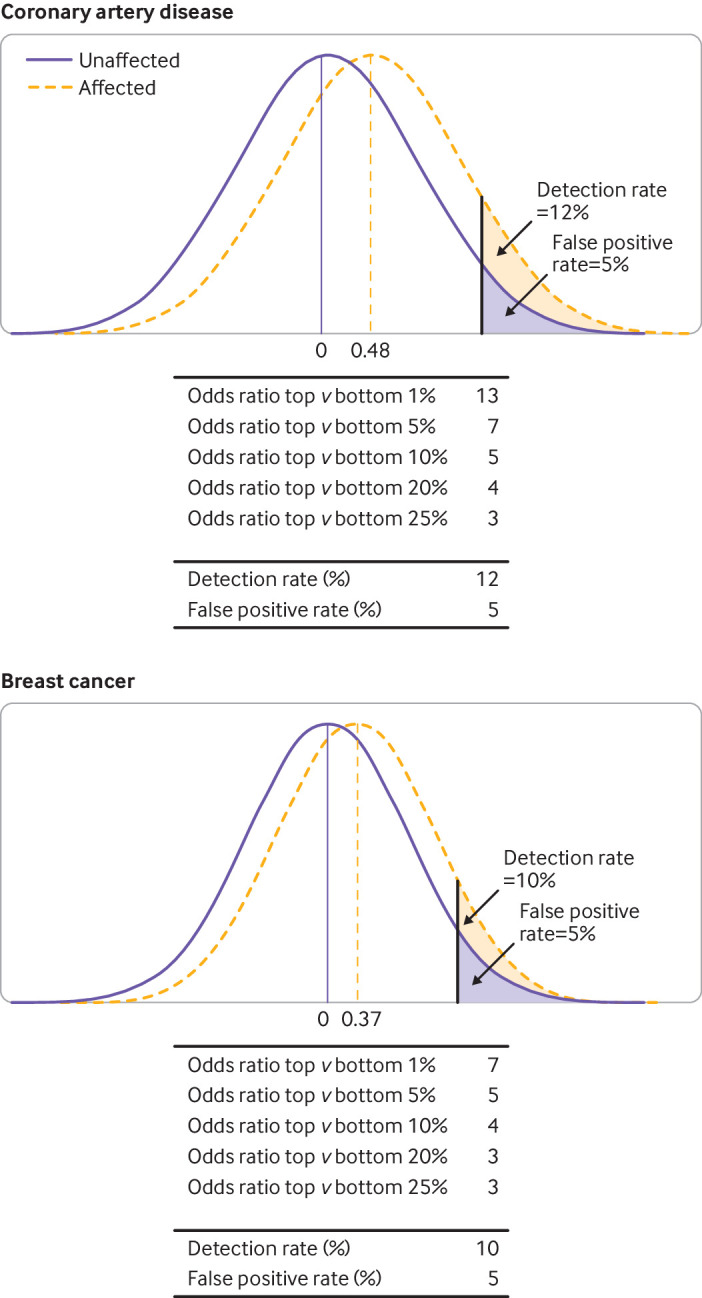
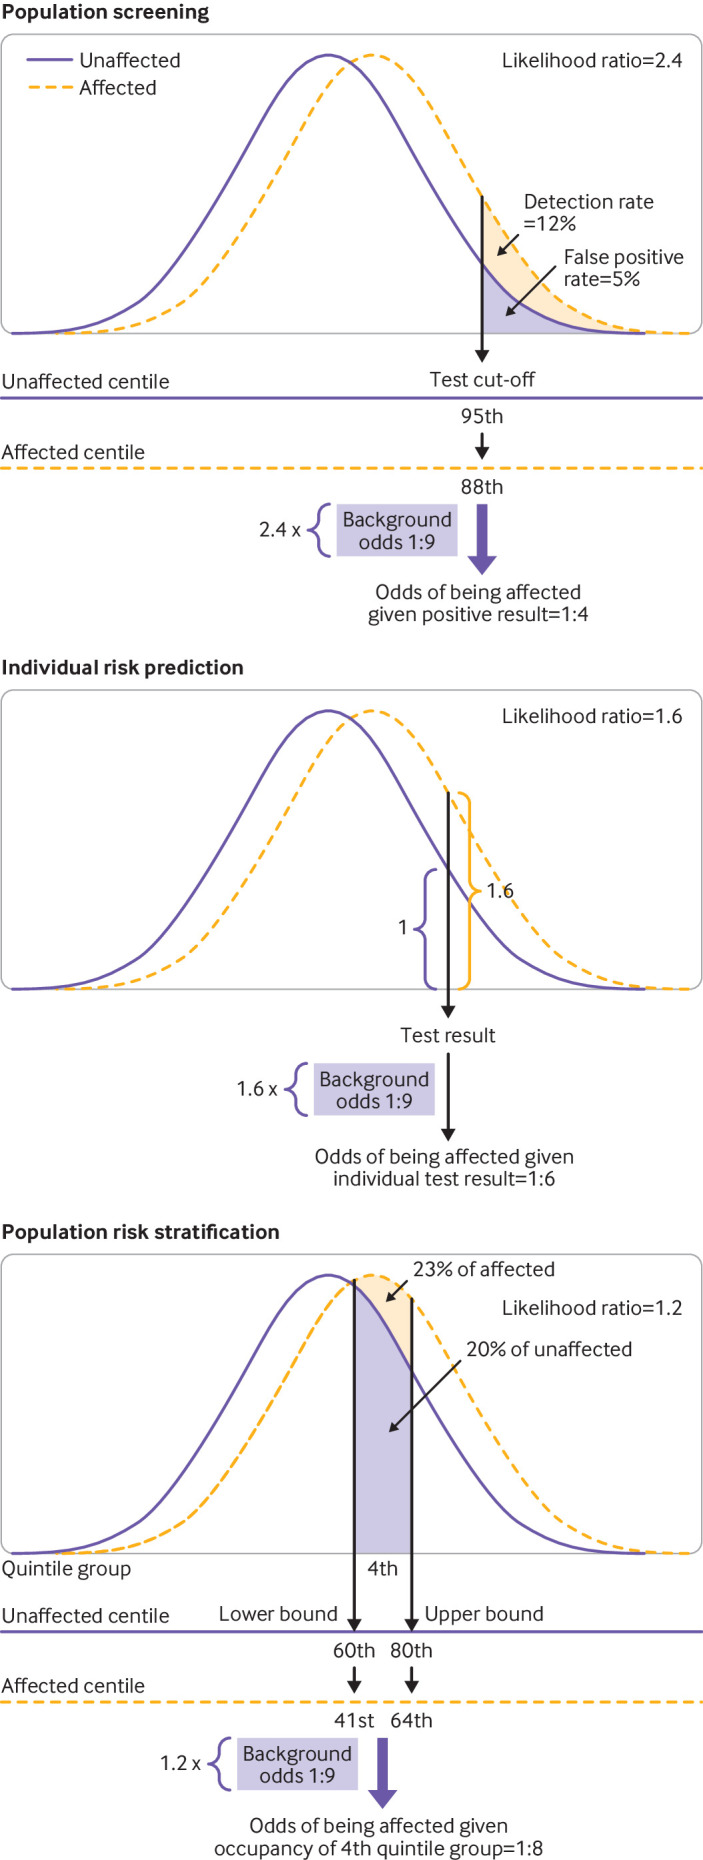
Main outcome measures: Detection rate for a 5% false positive rate (DR5) and the population odds of becoming affected given a positive result; individual odds of becoming affected for a person with a particular polygenic score; and odds of becoming affected for groups of individuals in different portions of a polygenic risk score distribution. Coronary artery disease and breast cancer were used as illustrative examples.
Results: For performance in population screening, median DR5 for all polygenic risk scores and all diseases studied was 11% (interquartile range 8-18%). Median DR5 was 12% (9-19%) for polygenic risk scores for coronary artery disease and 10% (9-12%) for breast cancer. The population odds of becoming affected given a positive results were 1:8 for coronary artery disease and 1:21 for breast cancer, with background 10 year odds of 1:19 and 1:41, respectively, which are typical for these diseases at age 50. For individual risk prediction, the corresponding 10 year odds of becoming affected for individuals aged 50 with a polygenic risk score at the 2.5th, 25th, 75th, and 97.5th centiles were 1:54, 1:29, 1:15, and 1:8 for coronary artery disease and 1:91, 1:56, 1:34, and 1:21 for breast cancer. In terms of population risk stratification, at age 50, the risk of coronary artery disease was divided into five groups, with 10 year odds of 1:41 and 1:11 for the lowest and highest quintile groups, respectively. The 10 year odds was 1:7 for the upper 2.5% of the polygenic risk score distribution for coronary artery disease, a group that contributed 7% of cases. The corresponding estimates for breast cancer were 1:72 and 1:26 for the lowest and highest quintile groups, and 1:19 for the upper 2.5% of the distribution, which contributed 6% of cases.
Conclusion: Polygenic risk scores performed poorly in population screening, individual risk prediction, and population risk stratification. Strong claims about the effect of polygenic risk scores on healthcare seem to be disproportionate to their performance.

 求助内容:
求助内容: 应助结果提醒方式:


