{"title":"使用Landsat和CHIRPS数据集,使用标准降水和植被指数,在区域范围内对葡萄园生产进行近实时干旱监测和评估","authors":"Sara Tokhi Arab, Tofael Ahamed","doi":"10.1007/s41685-023-00286-7","DOIUrl":null,"url":null,"abstract":"<div><p>Drought is a complicated and slow-moving natural disaster that has severe impacts on plant greenness and yields by interrupting plant photosynthetic activity. These issues mostly happen due to water shortages and elevated temperatures. Grapes are sensitive to water stress during the summer, when high evapotranspiration is combined with very low precipitation. Therefore, the main aim of this research was to identify drought-affected vineyards on a regional scale by satellite remote sensing images with a standardized precipitation index (SPI) and standard vegetation index (SVI). The time-series standard vegetation index (SVI) was developed from the time-series normalized difference vegetation index (NDVI) for 2013–2021, and the time-series SPI was calculated from time-series CHIRPS rainfall using the Google Earth engine (GEE). Drought severity maps were classified based on thresholds from extremely dry to extremely wet. Validation was performed between drought indices and grape yield at the regional level using regression analysis. The results indicated that the years 2013, 2014, 2015, 2016, 2018 and 2021 were characterized by drought across the region within the berry formation and veraison growth phases of table grape before harvest. The most drought-affected years were 2018 and 2021. In 2018, 4785.03 ha, and in 2021, 1825.83 ha were extremely affected by drought. Moreover, the validation results indicated that the highest variability of table grape yield with SPI (<i>r</i><sup>2</sup> = 0.62) was observed in June. However, table grape yield with SVI had the highest variation in July (<i>r</i><sup>2</sup> = 0.60). The multiple linear regression between the average yield (ton/ha) and drought indices (SVI and SPI) showed the highest accuracy in June (<i>r</i><sup>2</sup> = 0.79, MSE = 0.2) and July (<i>r</i><sup>2</sup> = 0.71, MSE = 0.3). These findings suggest that SVI and SPI can be utilized for large-scale near-real-time drought monitoring and assessment to develop a regional subsidy program to support grape growers during a drought.</p></div>","PeriodicalId":36164,"journal":{"name":"Asia-Pacific Journal of Regional Science","volume":"7 2","pages":"591 - 614"},"PeriodicalIF":1.9000,"publicationDate":"2023-04-03","publicationTypes":"Journal Article","fieldsOfStudy":null,"isOpenAccess":false,"openAccessPdf":"https://link.springer.com/content/pdf/10.1007/s41685-023-00286-7.pdf","citationCount":"1","resultStr":"{\"title\":\"Near-real-time drought monitoring and assessment for vineyard production on a regional scale with standard precipitation and vegetation indices using Landsat and CHIRPS datasets\",\"authors\":\"Sara Tokhi Arab, Tofael Ahamed\",\"doi\":\"10.1007/s41685-023-00286-7\",\"DOIUrl\":null,\"url\":null,\"abstract\":\"<div><p>Drought is a complicated and slow-moving natural disaster that has severe impacts on plant greenness and yields by interrupting plant photosynthetic activity. These issues mostly happen due to water shortages and elevated temperatures. Grapes are sensitive to water stress during the summer, when high evapotranspiration is combined with very low precipitation. Therefore, the main aim of this research was to identify drought-affected vineyards on a regional scale by satellite remote sensing images with a standardized precipitation index (SPI) and standard vegetation index (SVI). The time-series standard vegetation index (SVI) was developed from the time-series normalized difference vegetation index (NDVI) for 2013–2021, and the time-series SPI was calculated from time-series CHIRPS rainfall using the Google Earth engine (GEE). Drought severity maps were classified based on thresholds from extremely dry to extremely wet. Validation was performed between drought indices and grape yield at the regional level using regression analysis. The results indicated that the years 2013, 2014, 2015, 2016, 2018 and 2021 were characterized by drought across the region within the berry formation and veraison growth phases of table grape before harvest. The most drought-affected years were 2018 and 2021. In 2018, 4785.03 ha, and in 2021, 1825.83 ha were extremely affected by drought. Moreover, the validation results indicated that the highest variability of table grape yield with SPI (<i>r</i><sup>2</sup> = 0.62) was observed in June. However, table grape yield with SVI had the highest variation in July (<i>r</i><sup>2</sup> = 0.60). The multiple linear regression between the average yield (ton/ha) and drought indices (SVI and SPI) showed the highest accuracy in June (<i>r</i><sup>2</sup> = 0.79, MSE = 0.2) and July (<i>r</i><sup>2</sup> = 0.71, MSE = 0.3). These findings suggest that SVI and SPI can be utilized for large-scale near-real-time drought monitoring and assessment to develop a regional subsidy program to support grape growers during a drought.</p></div>\",\"PeriodicalId\":36164,\"journal\":{\"name\":\"Asia-Pacific Journal of Regional Science\",\"volume\":\"7 2\",\"pages\":\"591 - 614\"},\"PeriodicalIF\":1.9000,\"publicationDate\":\"2023-04-03\",\"publicationTypes\":\"Journal Article\",\"fieldsOfStudy\":null,\"isOpenAccess\":false,\"openAccessPdf\":\"https://link.springer.com/content/pdf/10.1007/s41685-023-00286-7.pdf\",\"citationCount\":\"1\",\"resultStr\":null,\"platform\":\"Semanticscholar\",\"paperid\":null,\"PeriodicalName\":\"Asia-Pacific Journal of Regional Science\",\"FirstCategoryId\":\"1085\",\"ListUrlMain\":\"https://link.springer.com/article/10.1007/s41685-023-00286-7\",\"RegionNum\":0,\"RegionCategory\":null,\"ArticlePicture\":[],\"TitleCN\":null,\"AbstractTextCN\":null,\"PMCID\":null,\"EPubDate\":\"\",\"PubModel\":\"\",\"JCR\":\"Q2\",\"JCRName\":\"ECONOMICS\",\"Score\":null,\"Total\":0}","platform":"Semanticscholar","paperid":null,"PeriodicalName":"Asia-Pacific Journal of Regional Science","FirstCategoryId":"1085","ListUrlMain":"https://link.springer.com/article/10.1007/s41685-023-00286-7","RegionNum":0,"RegionCategory":null,"ArticlePicture":[],"TitleCN":null,"AbstractTextCN":null,"PMCID":null,"EPubDate":"","PubModel":"","JCR":"Q2","JCRName":"ECONOMICS","Score":null,"Total":0}
Near-real-time drought monitoring and assessment for vineyard production on a regional scale with standard precipitation and vegetation indices using Landsat and CHIRPS datasets
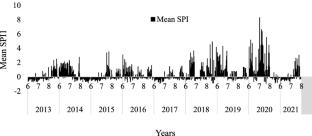
Drought is a complicated and slow-moving natural disaster that has severe impacts on plant greenness and yields by interrupting plant photosynthetic activity. These issues mostly happen due to water shortages and elevated temperatures. Grapes are sensitive to water stress during the summer, when high evapotranspiration is combined with very low precipitation. Therefore, the main aim of this research was to identify drought-affected vineyards on a regional scale by satellite remote sensing images with a standardized precipitation index (SPI) and standard vegetation index (SVI). The time-series standard vegetation index (SVI) was developed from the time-series normalized difference vegetation index (NDVI) for 2013–2021, and the time-series SPI was calculated from time-series CHIRPS rainfall using the Google Earth engine (GEE). Drought severity maps were classified based on thresholds from extremely dry to extremely wet. Validation was performed between drought indices and grape yield at the regional level using regression analysis. The results indicated that the years 2013, 2014, 2015, 2016, 2018 and 2021 were characterized by drought across the region within the berry formation and veraison growth phases of table grape before harvest. The most drought-affected years were 2018 and 2021. In 2018, 4785.03 ha, and in 2021, 1825.83 ha were extremely affected by drought. Moreover, the validation results indicated that the highest variability of table grape yield with SPI (r2 = 0.62) was observed in June. However, table grape yield with SVI had the highest variation in July (r2 = 0.60). The multiple linear regression between the average yield (ton/ha) and drought indices (SVI and SPI) showed the highest accuracy in June (r2 = 0.79, MSE = 0.2) and July (r2 = 0.71, MSE = 0.3). These findings suggest that SVI and SPI can be utilized for large-scale near-real-time drought monitoring and assessment to develop a regional subsidy program to support grape growers during a drought.
期刊介绍:
The Asia-Pacific Journal of Regional Science expands the frontiers of regional science through the diffusion of intrinsically developed and advanced modern, regional science methodologies throughout the Asia-Pacific region. Articles published in the journal foster progress and development of regional science through the promotion of comprehensive and interdisciplinary academic studies in relationship to research in regional science across the globe. The journal’s scope includes articles dedicated to theoretical economics, positive economics including econometrics and statistical analysis and input–output analysis, CGE, Simulation, applied economics including international economics, regional economics, industrial organization, analysis of governance and institutional issues, law and economics, migration and labor markets, spatial economics, land economics, urban economics, agricultural economics, environmental economics, behavioral economics and spatial analysis with GIS/RS data education economics, sociology including urban sociology, rural sociology, environmental sociology and educational sociology, as well as traffic engineering. The journal provides a unique platform for its research community to further develop, analyze, and resolve urgent regional and urban issues in Asia, and to further refine established research around the world in this multidisciplinary field. The journal invites original articles, proposals, and book reviews.The Asia-Pacific Journal of Regional Science is a new English-language journal that spun out of Chiikigakukenkyuu, which has a 45-year history of publishing the best Japanese research in regional science in the Japanese language and, more recently and more frequently, in English. The development of regional science as an international discipline has necessitated the need for a new publication in English. The Asia-Pacific Journal of Regional Science is a publishing vehicle for English-language contributions to the field in Japan, across the complete Asia-Pacific arena, and beyond.Content published in this journal is peer reviewed (Double Blind).
 求助内容:
求助内容: 应助结果提醒方式:


