{"title":"使用基于mri的脑结构萎缩率的聚类方法对退行性小脑共济失调的广谱疾病进展进行分层。","authors":"Rie Sasaki, Futaba Maki, Daisuke Hara, Shigeaki Tanaka, Yasuhiro Hasegawa","doi":"10.1186/s40673-017-0068-4","DOIUrl":null,"url":null,"abstract":"<p><strong>Background: </strong>The rate of disease progression differs among patients with degenerative cerebellar ataxia. The uncertain natural course in individual patients hinders clinical trials of promising treatments. In this study, we analyzed atrophy changes in brain structures with cluster analysis to find sub-groups of patients with homogenous symptom progression in a broad spectrum of degenerative cerebellar ataxias.</p><p><strong>Methods: </strong>We examined 48 patients including 21 cases of spinocerebellar ataxia (SCA), 17 cases of the cerebellar type of multiple system atrophy (MSA-C), and 10 cases of cortical cerebellar ataxia (CCA). In all patients, at least two sets of evaluations including magnetic resonance imaging (MRI) and the International Cooperative Ataxia Rating Scale (ICARS) scoring were performed. The median number (min-max) of follow-up studies in each patient was three (2-6), and the mean follow-up period was 3.1 ± 1.6 years. The area of the corpus callosum on midsagittal images and the cerebellar volume were measured using MRI, and these values were divided by the cranial antero-posterior diameter of each patient to correct for individual head size differences as an area index (Adx) and a volume index (Vdx), respectively. The annual changes in Adx, Vdx, and ICARS score were calculated in each patient, and atrophy patterns in patients were categorized with cluster analysis.</p><p><strong>Results: </strong>The annual atrophy rates for the corpus callosum (Adx) and cerebellum (Vdx) and symptom progression differed significantly by subtype of cerebellar ataxia (<i>p</i> = 0.026, 0.019, and 0.021, respectively). However, neither the annual atrophy rate of Adx nor Vdx was significantly correlated with the annual increase in the ICARS score. When the patients were categorized into three clusters based on the annual changes in Adx and Vdx, the annual increase in the ICARS score was significantly different among clusters (2.9 ± 1.7/year in Cluster 1, 4.8 ± 3.2/year in Cluster 2, and 8.7 ± 6.1/year in Cluster 3; <i>p</i> = 0.014).</p><p><strong>Conclusions: </strong>The annual increase in the ICARS score can be stratified by cluster analysis based on the atrophy rates of the corpus callosum and cerebellum. Further studies are warranted to explore whether these simple MRI methods could be used for random allocation of a broad spectrum of patients with degenerative cerebellar ataxia in clinical trials.</p>","PeriodicalId":36752,"journal":{"name":"Cerebellum and Ataxias","volume":"4 ","pages":"9"},"PeriodicalIF":0.0000,"publicationDate":"2017-06-29","publicationTypes":"Journal Article","fieldsOfStudy":null,"isOpenAccess":false,"openAccessPdf":"https://sci-hub-pdf.com/10.1186/s40673-017-0068-4","citationCount":"4","resultStr":"{\"title\":\"Stratification of disease progression in a broad spectrum of degenerative cerebellar ataxias with a clustering method using MRI-based atrophy rates of brain structures.\",\"authors\":\"Rie Sasaki, Futaba Maki, Daisuke Hara, Shigeaki Tanaka, Yasuhiro Hasegawa\",\"doi\":\"10.1186/s40673-017-0068-4\",\"DOIUrl\":null,\"url\":null,\"abstract\":\"<p><strong>Background: </strong>The rate of disease progression differs among patients with degenerative cerebellar ataxia. The uncertain natural course in individual patients hinders clinical trials of promising treatments. In this study, we analyzed atrophy changes in brain structures with cluster analysis to find sub-groups of patients with homogenous symptom progression in a broad spectrum of degenerative cerebellar ataxias.</p><p><strong>Methods: </strong>We examined 48 patients including 21 cases of spinocerebellar ataxia (SCA), 17 cases of the cerebellar type of multiple system atrophy (MSA-C), and 10 cases of cortical cerebellar ataxia (CCA). In all patients, at least two sets of evaluations including magnetic resonance imaging (MRI) and the International Cooperative Ataxia Rating Scale (ICARS) scoring were performed. The median number (min-max) of follow-up studies in each patient was three (2-6), and the mean follow-up period was 3.1 ± 1.6 years. The area of the corpus callosum on midsagittal images and the cerebellar volume were measured using MRI, and these values were divided by the cranial antero-posterior diameter of each patient to correct for individual head size differences as an area index (Adx) and a volume index (Vdx), respectively. The annual changes in Adx, Vdx, and ICARS score were calculated in each patient, and atrophy patterns in patients were categorized with cluster analysis.</p><p><strong>Results: </strong>The annual atrophy rates for the corpus callosum (Adx) and cerebellum (Vdx) and symptom progression differed significantly by subtype of cerebellar ataxia (<i>p</i> = 0.026, 0.019, and 0.021, respectively). However, neither the annual atrophy rate of Adx nor Vdx was significantly correlated with the annual increase in the ICARS score. When the patients were categorized into three clusters based on the annual changes in Adx and Vdx, the annual increase in the ICARS score was significantly different among clusters (2.9 ± 1.7/year in Cluster 1, 4.8 ± 3.2/year in Cluster 2, and 8.7 ± 6.1/year in Cluster 3; <i>p</i> = 0.014).</p><p><strong>Conclusions: </strong>The annual increase in the ICARS score can be stratified by cluster analysis based on the atrophy rates of the corpus callosum and cerebellum. Further studies are warranted to explore whether these simple MRI methods could be used for random allocation of a broad spectrum of patients with degenerative cerebellar ataxia in clinical trials.</p>\",\"PeriodicalId\":36752,\"journal\":{\"name\":\"Cerebellum and Ataxias\",\"volume\":\"4 \",\"pages\":\"9\"},\"PeriodicalIF\":0.0000,\"publicationDate\":\"2017-06-29\",\"publicationTypes\":\"Journal Article\",\"fieldsOfStudy\":null,\"isOpenAccess\":false,\"openAccessPdf\":\"https://sci-hub-pdf.com/10.1186/s40673-017-0068-4\",\"citationCount\":\"4\",\"resultStr\":null,\"platform\":\"Semanticscholar\",\"paperid\":null,\"PeriodicalName\":\"Cerebellum and Ataxias\",\"FirstCategoryId\":\"1085\",\"ListUrlMain\":\"https://doi.org/10.1186/s40673-017-0068-4\",\"RegionNum\":0,\"RegionCategory\":null,\"ArticlePicture\":[],\"TitleCN\":null,\"AbstractTextCN\":null,\"PMCID\":null,\"EPubDate\":\"2017/1/1 0:00:00\",\"PubModel\":\"eCollection\",\"JCR\":\"Q3\",\"JCRName\":\"Medicine\",\"Score\":null,\"Total\":0}","platform":"Semanticscholar","paperid":null,"PeriodicalName":"Cerebellum and Ataxias","FirstCategoryId":"1085","ListUrlMain":"https://doi.org/10.1186/s40673-017-0068-4","RegionNum":0,"RegionCategory":null,"ArticlePicture":[],"TitleCN":null,"AbstractTextCN":null,"PMCID":null,"EPubDate":"2017/1/1 0:00:00","PubModel":"eCollection","JCR":"Q3","JCRName":"Medicine","Score":null,"Total":0}
Stratification of disease progression in a broad spectrum of degenerative cerebellar ataxias with a clustering method using MRI-based atrophy rates of brain structures.
Background: The rate of disease progression differs among patients with degenerative cerebellar ataxia. The uncertain natural course in individual patients hinders clinical trials of promising treatments. In this study, we analyzed atrophy changes in brain structures with cluster analysis to find sub-groups of patients with homogenous symptom progression in a broad spectrum of degenerative cerebellar ataxias.
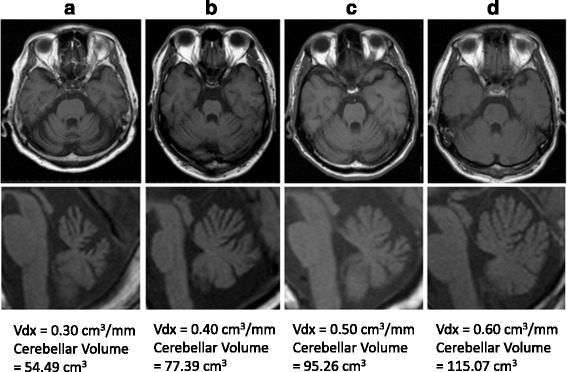
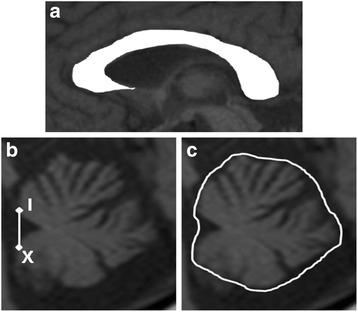
Methods: We examined 48 patients including 21 cases of spinocerebellar ataxia (SCA), 17 cases of the cerebellar type of multiple system atrophy (MSA-C), and 10 cases of cortical cerebellar ataxia (CCA). In all patients, at least two sets of evaluations including magnetic resonance imaging (MRI) and the International Cooperative Ataxia Rating Scale (ICARS) scoring were performed. The median number (min-max) of follow-up studies in each patient was three (2-6), and the mean follow-up period was 3.1 ± 1.6 years. The area of the corpus callosum on midsagittal images and the cerebellar volume were measured using MRI, and these values were divided by the cranial antero-posterior diameter of each patient to correct for individual head size differences as an area index (Adx) and a volume index (Vdx), respectively. The annual changes in Adx, Vdx, and ICARS score were calculated in each patient, and atrophy patterns in patients were categorized with cluster analysis.
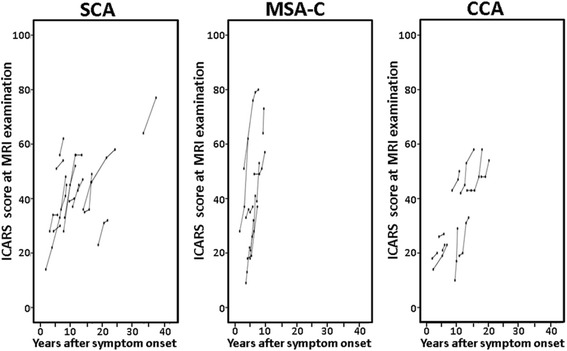
Results: The annual atrophy rates for the corpus callosum (Adx) and cerebellum (Vdx) and symptom progression differed significantly by subtype of cerebellar ataxia (p = 0.026, 0.019, and 0.021, respectively). However, neither the annual atrophy rate of Adx nor Vdx was significantly correlated with the annual increase in the ICARS score. When the patients were categorized into three clusters based on the annual changes in Adx and Vdx, the annual increase in the ICARS score was significantly different among clusters (2.9 ± 1.7/year in Cluster 1, 4.8 ± 3.2/year in Cluster 2, and 8.7 ± 6.1/year in Cluster 3; p = 0.014).
Conclusions: The annual increase in the ICARS score can be stratified by cluster analysis based on the atrophy rates of the corpus callosum and cerebellum. Further studies are warranted to explore whether these simple MRI methods could be used for random allocation of a broad spectrum of patients with degenerative cerebellar ataxia in clinical trials.

 求助内容:
求助内容: 应助结果提醒方式:


