{"title":"基因表达实验中生物学相关反应曲线的比较分析:异型、异时性和异量。","authors":"Stuart G Baker","doi":"10.3390/microarrays3010039","DOIUrl":null,"url":null,"abstract":"<p><p>To gain biological insights, investigators sometimes compare sequences of gene expression measurements under two scenarios (such as two drugs or species). For this situation, we developed an algorithm to fit, identify, and compare biologically relevant response curves in terms of heteromorphy (different curves), heterochrony (different transition times), and heterometry (different magnitudes). The curves are flat, linear, sigmoid, hockey-stick (sigmoid missing a steady state), transient (sigmoid missing two steady states), impulse (with peak or trough), step (with intermediate-level plateau), impulse+ (impulse with an extra parameter), step+ (step with an extra parameter), further characterized by upward or downward trend. To reduce overfitting, we fit the curves to every other response, evaluated the fit in the remaining responses, and identified the most parsimonious curves that yielded a good fit. We measured goodness of fit using a statistic comparable over different genes, namely the square root of the mean squared prediction error as a percentage of the range of responses, which we call the relative prediction error (RPE). We illustrated the algorithm using data on gene expression at 14 times in the embryonic development in two species of frogs. Software written in Mathematica is freely available. </p>","PeriodicalId":56355,"journal":{"name":"Microarrays","volume":"3 1","pages":"39-51"},"PeriodicalIF":0.0000,"publicationDate":"2014-02-14","publicationTypes":"Journal Article","fieldsOfStudy":null,"isOpenAccess":false,"openAccessPdf":"https://sci-hub-pdf.com/10.3390/microarrays3010039","citationCount":"0","resultStr":"{\"title\":\"Comparative Analysis of Biologically Relevant Response Curves in Gene Expression Experiments: Heteromorphy, Heterochrony, and Heterometry.\",\"authors\":\"Stuart G Baker\",\"doi\":\"10.3390/microarrays3010039\",\"DOIUrl\":null,\"url\":null,\"abstract\":\"<p><p>To gain biological insights, investigators sometimes compare sequences of gene expression measurements under two scenarios (such as two drugs or species). For this situation, we developed an algorithm to fit, identify, and compare biologically relevant response curves in terms of heteromorphy (different curves), heterochrony (different transition times), and heterometry (different magnitudes). The curves are flat, linear, sigmoid, hockey-stick (sigmoid missing a steady state), transient (sigmoid missing two steady states), impulse (with peak or trough), step (with intermediate-level plateau), impulse+ (impulse with an extra parameter), step+ (step with an extra parameter), further characterized by upward or downward trend. To reduce overfitting, we fit the curves to every other response, evaluated the fit in the remaining responses, and identified the most parsimonious curves that yielded a good fit. We measured goodness of fit using a statistic comparable over different genes, namely the square root of the mean squared prediction error as a percentage of the range of responses, which we call the relative prediction error (RPE). We illustrated the algorithm using data on gene expression at 14 times in the embryonic development in two species of frogs. Software written in Mathematica is freely available. </p>\",\"PeriodicalId\":56355,\"journal\":{\"name\":\"Microarrays\",\"volume\":\"3 1\",\"pages\":\"39-51\"},\"PeriodicalIF\":0.0000,\"publicationDate\":\"2014-02-14\",\"publicationTypes\":\"Journal Article\",\"fieldsOfStudy\":null,\"isOpenAccess\":false,\"openAccessPdf\":\"https://sci-hub-pdf.com/10.3390/microarrays3010039\",\"citationCount\":\"0\",\"resultStr\":null,\"platform\":\"Semanticscholar\",\"paperid\":null,\"PeriodicalName\":\"Microarrays\",\"FirstCategoryId\":\"1085\",\"ListUrlMain\":\"https://doi.org/10.3390/microarrays3010039\",\"RegionNum\":0,\"RegionCategory\":null,\"ArticlePicture\":[],\"TitleCN\":null,\"AbstractTextCN\":null,\"PMCID\":null,\"EPubDate\":\"\",\"PubModel\":\"\",\"JCR\":\"\",\"JCRName\":\"\",\"Score\":null,\"Total\":0}","platform":"Semanticscholar","paperid":null,"PeriodicalName":"Microarrays","FirstCategoryId":"1085","ListUrlMain":"https://doi.org/10.3390/microarrays3010039","RegionNum":0,"RegionCategory":null,"ArticlePicture":[],"TitleCN":null,"AbstractTextCN":null,"PMCID":null,"EPubDate":"","PubModel":"","JCR":"","JCRName":"","Score":null,"Total":0}
Comparative Analysis of Biologically Relevant Response Curves in Gene Expression Experiments: Heteromorphy, Heterochrony, and Heterometry.
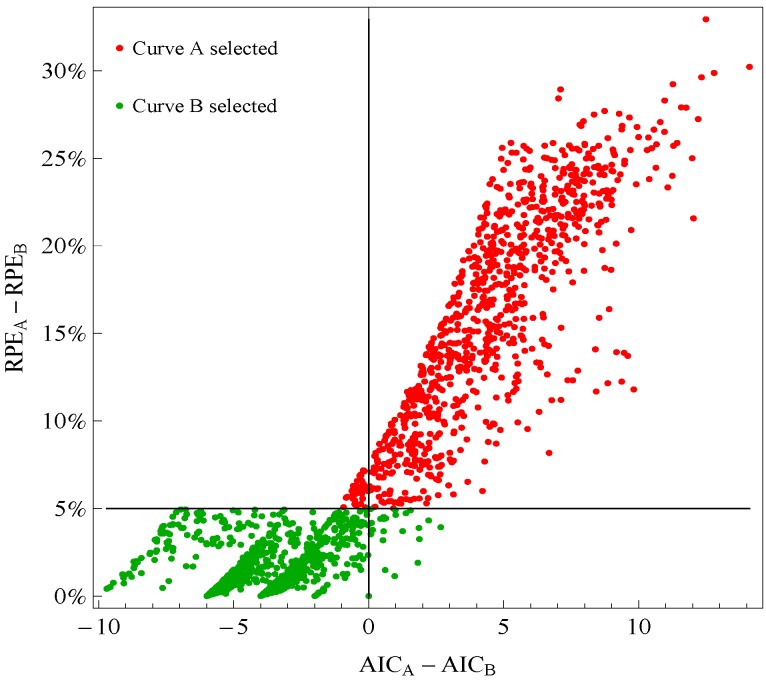
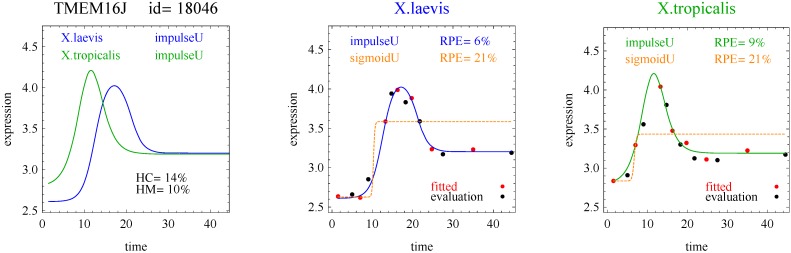
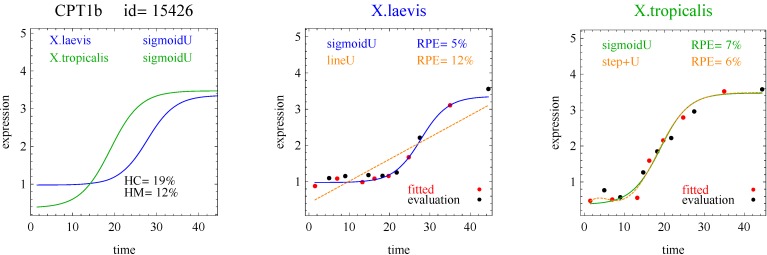
To gain biological insights, investigators sometimes compare sequences of gene expression measurements under two scenarios (such as two drugs or species). For this situation, we developed an algorithm to fit, identify, and compare biologically relevant response curves in terms of heteromorphy (different curves), heterochrony (different transition times), and heterometry (different magnitudes). The curves are flat, linear, sigmoid, hockey-stick (sigmoid missing a steady state), transient (sigmoid missing two steady states), impulse (with peak or trough), step (with intermediate-level plateau), impulse+ (impulse with an extra parameter), step+ (step with an extra parameter), further characterized by upward or downward trend. To reduce overfitting, we fit the curves to every other response, evaluated the fit in the remaining responses, and identified the most parsimonious curves that yielded a good fit. We measured goodness of fit using a statistic comparable over different genes, namely the square root of the mean squared prediction error as a percentage of the range of responses, which we call the relative prediction error (RPE). We illustrated the algorithm using data on gene expression at 14 times in the embryonic development in two species of frogs. Software written in Mathematica is freely available.
期刊介绍:
High-Throughput (formerly Microarrays, ISSN 2076-3905) is a multidisciplinary peer-reviewed scientific journal that provides an advanced forum for the publication of studies reporting high-dimensional approaches and developments in Life Sciences, Chemistry and related fields. Our aim is to encourage scientists to publish their experimental and theoretical results based on high-throughput techniques as well as computational and statistical tools for data analysis and interpretation. The full experimental or methodological details must be provided so that the results can be reproduced. There is no restriction on the length of the papers. High-Throughput invites submissions covering several topics, including, but not limited to: Microarrays, DNA Sequencing, RNA Sequencing, Protein Identification and Quantification, Cell-based Approaches, Omics Technologies, Imaging, Bioinformatics, Computational Biology/Chemistry, Statistics, Integrative Omics, Drug Discovery and Development, Microfluidics, Lab-on-a-chip, Data Mining, Databases, Multiplex Assays.

 求助内容:
求助内容: 应助结果提醒方式:


