{"title":"利用地理信息系统为某一特殊图书馆确定潜在的销售区域。","authors":"Rozalynd P McConnaughy, Steven P Wilson","doi":"10.1186/1742-5581-3-4","DOIUrl":null,"url":null,"abstract":"<p><strong>Background: </strong>The Center for Disability Resources (CDR) Library is the largest collection of its kind in the Southeastern United States, consisting of over 5,200 books, videos/DVDs, brochures, and audiotapes covering a variety of disability-related topics, from autism to transition resources. The purpose of the library is to support the information needs of families, faculty, students, staff, and other professionals in South Carolina working with individuals with disabilities. The CDR Library is funded on a yearly basis; therefore, maintaining high usage is crucial. A variety of promotional efforts have been used to attract new patrons to the library. Anyone in South Carolina can check out materials from the library, and most of the patrons use the library remotely by requesting materials, which are then mailed to them. The goal of this project was to identify areas of low geographic usage as a means of identifying locations for future library marketing efforts.</p><p><strong>Methods: </strong>Nearly four years worth of library statistics were compiled in a spreadsheet that provided information per county on the number of checkouts, the number of renewals, and the population. Five maps were created using ArcView GIS software to create visual representations of patron checkout and renewal behavior per county.</p><p><strong>Results: </strong>Out of the 46 counties in South Carolina, eight counties never checked out materials from the library. As expected urban areas and counties near the library's physical location have high usage totals.</p><p><strong>Conclusion: </strong>The visual representation of the data made identification of low usage regions easier than using a standalone database with no visual-spatial component. The low usage counties will be the focus of future Center for Disability Resources Library marketing efforts. Due to the impressive visual-spatial representations created with Geographic Information Systems, which more efficiently communicate information than stand-alone database information can, librarians may benefit from the software's use as a supplemental tool for tracking library usage and planning promotional efforts.</p>","PeriodicalId":87058,"journal":{"name":"Biomedical digital libraries","volume":"3 ","pages":"4"},"PeriodicalIF":0.0000,"publicationDate":"2006-05-04","publicationTypes":"Journal Article","fieldsOfStudy":null,"isOpenAccess":false,"openAccessPdf":"https://sci-hub-pdf.com/10.1186/1742-5581-3-4","citationCount":"4","resultStr":"{\"title\":\"Using geographic information systems to identify prospective marketing areas for a special library.\",\"authors\":\"Rozalynd P McConnaughy, Steven P Wilson\",\"doi\":\"10.1186/1742-5581-3-4\",\"DOIUrl\":null,\"url\":null,\"abstract\":\"<p><strong>Background: </strong>The Center for Disability Resources (CDR) Library is the largest collection of its kind in the Southeastern United States, consisting of over 5,200 books, videos/DVDs, brochures, and audiotapes covering a variety of disability-related topics, from autism to transition resources. The purpose of the library is to support the information needs of families, faculty, students, staff, and other professionals in South Carolina working with individuals with disabilities. The CDR Library is funded on a yearly basis; therefore, maintaining high usage is crucial. A variety of promotional efforts have been used to attract new patrons to the library. Anyone in South Carolina can check out materials from the library, and most of the patrons use the library remotely by requesting materials, which are then mailed to them. The goal of this project was to identify areas of low geographic usage as a means of identifying locations for future library marketing efforts.</p><p><strong>Methods: </strong>Nearly four years worth of library statistics were compiled in a spreadsheet that provided information per county on the number of checkouts, the number of renewals, and the population. Five maps were created using ArcView GIS software to create visual representations of patron checkout and renewal behavior per county.</p><p><strong>Results: </strong>Out of the 46 counties in South Carolina, eight counties never checked out materials from the library. As expected urban areas and counties near the library's physical location have high usage totals.</p><p><strong>Conclusion: </strong>The visual representation of the data made identification of low usage regions easier than using a standalone database with no visual-spatial component. The low usage counties will be the focus of future Center for Disability Resources Library marketing efforts. Due to the impressive visual-spatial representations created with Geographic Information Systems, which more efficiently communicate information than stand-alone database information can, librarians may benefit from the software's use as a supplemental tool for tracking library usage and planning promotional efforts.</p>\",\"PeriodicalId\":87058,\"journal\":{\"name\":\"Biomedical digital libraries\",\"volume\":\"3 \",\"pages\":\"4\"},\"PeriodicalIF\":0.0000,\"publicationDate\":\"2006-05-04\",\"publicationTypes\":\"Journal Article\",\"fieldsOfStudy\":null,\"isOpenAccess\":false,\"openAccessPdf\":\"https://sci-hub-pdf.com/10.1186/1742-5581-3-4\",\"citationCount\":\"4\",\"resultStr\":null,\"platform\":\"Semanticscholar\",\"paperid\":null,\"PeriodicalName\":\"Biomedical digital libraries\",\"FirstCategoryId\":\"1085\",\"ListUrlMain\":\"https://doi.org/10.1186/1742-5581-3-4\",\"RegionNum\":0,\"RegionCategory\":null,\"ArticlePicture\":[],\"TitleCN\":null,\"AbstractTextCN\":null,\"PMCID\":null,\"EPubDate\":\"\",\"PubModel\":\"\",\"JCR\":\"\",\"JCRName\":\"\",\"Score\":null,\"Total\":0}","platform":"Semanticscholar","paperid":null,"PeriodicalName":"Biomedical digital libraries","FirstCategoryId":"1085","ListUrlMain":"https://doi.org/10.1186/1742-5581-3-4","RegionNum":0,"RegionCategory":null,"ArticlePicture":[],"TitleCN":null,"AbstractTextCN":null,"PMCID":null,"EPubDate":"","PubModel":"","JCR":"","JCRName":"","Score":null,"Total":0}
Using geographic information systems to identify prospective marketing areas for a special library.
Background: The Center for Disability Resources (CDR) Library is the largest collection of its kind in the Southeastern United States, consisting of over 5,200 books, videos/DVDs, brochures, and audiotapes covering a variety of disability-related topics, from autism to transition resources. The purpose of the library is to support the information needs of families, faculty, students, staff, and other professionals in South Carolina working with individuals with disabilities. The CDR Library is funded on a yearly basis; therefore, maintaining high usage is crucial. A variety of promotional efforts have been used to attract new patrons to the library. Anyone in South Carolina can check out materials from the library, and most of the patrons use the library remotely by requesting materials, which are then mailed to them. The goal of this project was to identify areas of low geographic usage as a means of identifying locations for future library marketing efforts.
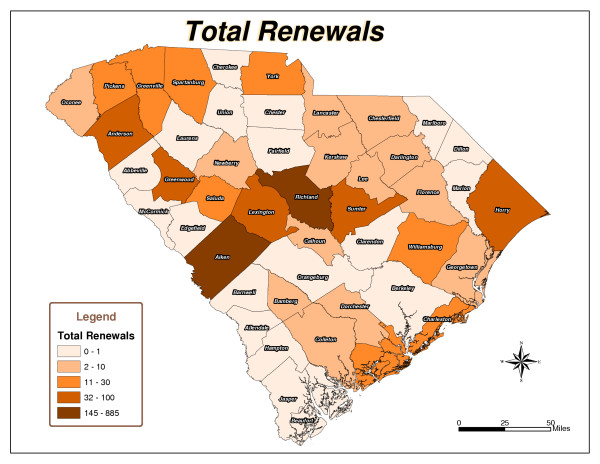
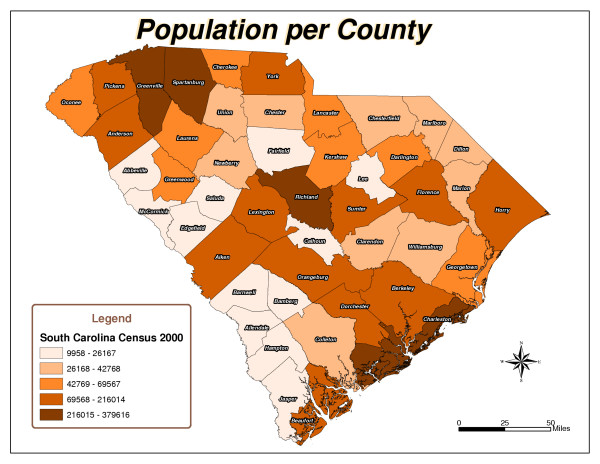
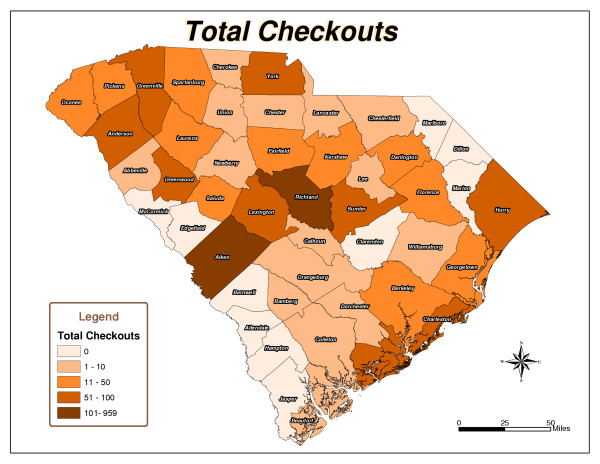
Methods: Nearly four years worth of library statistics were compiled in a spreadsheet that provided information per county on the number of checkouts, the number of renewals, and the population. Five maps were created using ArcView GIS software to create visual representations of patron checkout and renewal behavior per county.
Results: Out of the 46 counties in South Carolina, eight counties never checked out materials from the library. As expected urban areas and counties near the library's physical location have high usage totals.
Conclusion: The visual representation of the data made identification of low usage regions easier than using a standalone database with no visual-spatial component. The low usage counties will be the focus of future Center for Disability Resources Library marketing efforts. Due to the impressive visual-spatial representations created with Geographic Information Systems, which more efficiently communicate information than stand-alone database information can, librarians may benefit from the software's use as a supplemental tool for tracking library usage and planning promotional efforts.

 求助内容:
求助内容: 应助结果提醒方式:


