Thanyaluck Sriboonreung, Jirakrit Leelarungrayub, Araya Yankai, Rungthip Puntumetakul
{"title":"19 - 50岁泰国健康参与者肺功能、人口统计学和人体测量学与MIP/MEP的相关性和预测方程","authors":"Thanyaluck Sriboonreung, Jirakrit Leelarungrayub, Araya Yankai, Rungthip Puntumetakul","doi":"10.1177/11795484211004494","DOIUrl":null,"url":null,"abstract":"<p><strong>Objective: </strong>To identify the correlations and possible predicted equations of maximal inspiratory (MIP) and expiratory mouth pressure (MEP) values from pulmonary function test (PFT), demographics, and anthropometrics.</p><p><strong>Methods: </strong>This study involved 217 healthy participants (91 males and 126 females) aged 19 to 50 years. The PFT (forced vital capacity; FVC, forced expiratory volume in 1 second; FEV1, maximal mid-expiratory flow; MMEF, and peak expiratory flow; PEF) was performed by spirometry, whereas MIP and MEP were evaluated by a respiratory pressure meter. Pearson correlation and multiple linear regression, with the stepwise method, were used for statistical analysis.</p><p><strong>Results: </strong>The MIP and MEP had a significant positive correlation with weight, height, body mass index (BMI), and waist circumference. MIP had a significant positive correlation with FVC (%) and PEF (L/s and %), as well as a negative correlation with FEV1/FVC (ratio and %) and MMEF (%). Whereas, MEP showed a significant positive correlation with PEF (L/s and %) and negative correlation with FEV1/FVC (ratio and %) and MMEF (L/s). Finally, the predicted MIP and MEP equations were 103.988-97.70 × FEV1/FVC + 31.292 × Sex (male = 1 and female = 0) + 0.662 × PEF (%) and 47.384 + 3.603 × PEF (L/s)-9.514 × MMEF(L/s) + 30.458 × Sex (male = 1 and female = 0) + 0.534 × PEF (%), respectively.</p><p><strong>Conclusion: </strong>The respiratory muscle strengths can be predicted from the pulmonary function test, and gender data.</p>","PeriodicalId":44269,"journal":{"name":"Clinical Medicine Insights-Circulatory Respiratory and Pulmonary Medicine","volume":" ","pages":"11795484211004494"},"PeriodicalIF":0.9000,"publicationDate":"2021-03-22","publicationTypes":"Journal Article","fieldsOfStudy":null,"isOpenAccess":false,"openAccessPdf":"https://sci-hub-pdf.com/10.1177/11795484211004494","citationCount":"5","resultStr":"{\"title\":\"Correlation and Predicted Equations of MIP/MEP from the Pulmonary Function, Demographics and Anthropometrics in Healthy Thai Participants aged 19 to 50 Years.\",\"authors\":\"Thanyaluck Sriboonreung, Jirakrit Leelarungrayub, Araya Yankai, Rungthip Puntumetakul\",\"doi\":\"10.1177/11795484211004494\",\"DOIUrl\":null,\"url\":null,\"abstract\":\"<p><strong>Objective: </strong>To identify the correlations and possible predicted equations of maximal inspiratory (MIP) and expiratory mouth pressure (MEP) values from pulmonary function test (PFT), demographics, and anthropometrics.</p><p><strong>Methods: </strong>This study involved 217 healthy participants (91 males and 126 females) aged 19 to 50 years. The PFT (forced vital capacity; FVC, forced expiratory volume in 1 second; FEV1, maximal mid-expiratory flow; MMEF, and peak expiratory flow; PEF) was performed by spirometry, whereas MIP and MEP were evaluated by a respiratory pressure meter. Pearson correlation and multiple linear regression, with the stepwise method, were used for statistical analysis.</p><p><strong>Results: </strong>The MIP and MEP had a significant positive correlation with weight, height, body mass index (BMI), and waist circumference. MIP had a significant positive correlation with FVC (%) and PEF (L/s and %), as well as a negative correlation with FEV1/FVC (ratio and %) and MMEF (%). Whereas, MEP showed a significant positive correlation with PEF (L/s and %) and negative correlation with FEV1/FVC (ratio and %) and MMEF (L/s). Finally, the predicted MIP and MEP equations were 103.988-97.70 × FEV1/FVC + 31.292 × Sex (male = 1 and female = 0) + 0.662 × PEF (%) and 47.384 + 3.603 × PEF (L/s)-9.514 × MMEF(L/s) + 30.458 × Sex (male = 1 and female = 0) + 0.534 × PEF (%), respectively.</p><p><strong>Conclusion: </strong>The respiratory muscle strengths can be predicted from the pulmonary function test, and gender data.</p>\",\"PeriodicalId\":44269,\"journal\":{\"name\":\"Clinical Medicine Insights-Circulatory Respiratory and Pulmonary Medicine\",\"volume\":\" \",\"pages\":\"11795484211004494\"},\"PeriodicalIF\":0.9000,\"publicationDate\":\"2021-03-22\",\"publicationTypes\":\"Journal Article\",\"fieldsOfStudy\":null,\"isOpenAccess\":false,\"openAccessPdf\":\"https://sci-hub-pdf.com/10.1177/11795484211004494\",\"citationCount\":\"5\",\"resultStr\":null,\"platform\":\"Semanticscholar\",\"paperid\":null,\"PeriodicalName\":\"Clinical Medicine Insights-Circulatory Respiratory and Pulmonary Medicine\",\"FirstCategoryId\":\"1085\",\"ListUrlMain\":\"https://doi.org/10.1177/11795484211004494\",\"RegionNum\":0,\"RegionCategory\":null,\"ArticlePicture\":[],\"TitleCN\":null,\"AbstractTextCN\":null,\"PMCID\":null,\"EPubDate\":\"2021/1/1 0:00:00\",\"PubModel\":\"eCollection\",\"JCR\":\"Q4\",\"JCRName\":\"RESPIRATORY SYSTEM\",\"Score\":null,\"Total\":0}","platform":"Semanticscholar","paperid":null,"PeriodicalName":"Clinical Medicine Insights-Circulatory Respiratory and Pulmonary Medicine","FirstCategoryId":"1085","ListUrlMain":"https://doi.org/10.1177/11795484211004494","RegionNum":0,"RegionCategory":null,"ArticlePicture":[],"TitleCN":null,"AbstractTextCN":null,"PMCID":null,"EPubDate":"2021/1/1 0:00:00","PubModel":"eCollection","JCR":"Q4","JCRName":"RESPIRATORY SYSTEM","Score":null,"Total":0}
Correlation and Predicted Equations of MIP/MEP from the Pulmonary Function, Demographics and Anthropometrics in Healthy Thai Participants aged 19 to 50 Years.
Objective: To identify the correlations and possible predicted equations of maximal inspiratory (MIP) and expiratory mouth pressure (MEP) values from pulmonary function test (PFT), demographics, and anthropometrics.
Methods: This study involved 217 healthy participants (91 males and 126 females) aged 19 to 50 years. The PFT (forced vital capacity; FVC, forced expiratory volume in 1 second; FEV1, maximal mid-expiratory flow; MMEF, and peak expiratory flow; PEF) was performed by spirometry, whereas MIP and MEP were evaluated by a respiratory pressure meter. Pearson correlation and multiple linear regression, with the stepwise method, were used for statistical analysis.
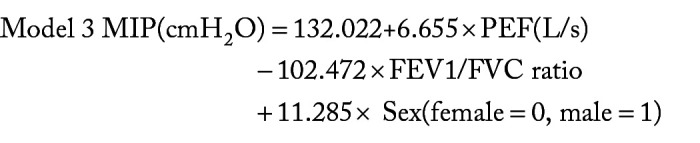
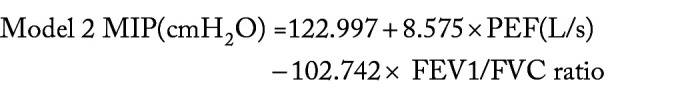
Results: The MIP and MEP had a significant positive correlation with weight, height, body mass index (BMI), and waist circumference. MIP had a significant positive correlation with FVC (%) and PEF (L/s and %), as well as a negative correlation with FEV1/FVC (ratio and %) and MMEF (%). Whereas, MEP showed a significant positive correlation with PEF (L/s and %) and negative correlation with FEV1/FVC (ratio and %) and MMEF (L/s). Finally, the predicted MIP and MEP equations were 103.988-97.70 × FEV1/FVC + 31.292 × Sex (male = 1 and female = 0) + 0.662 × PEF (%) and 47.384 + 3.603 × PEF (L/s)-9.514 × MMEF(L/s) + 30.458 × Sex (male = 1 and female = 0) + 0.534 × PEF (%), respectively.
Conclusion: The respiratory muscle strengths can be predicted from the pulmonary function test, and gender data.


 求助内容:
求助内容: 应助结果提醒方式:


