{"title":"利用GIS建立公共图书馆消费者健康数据库。","authors":"Elizabeth M Larue","doi":"10.1186/1742-5581-1-3","DOIUrl":null,"url":null,"abstract":"<p><p>BACKGROUND: Learning the exact demographic characteristics of a neighborhood in which a public library serves, assists the collection development librarian in building an appropriate collection. Gathering that demographic information can be a lengthy process, and then formatting the information for the neighborhood in question becomes arduous.As society ages and the methods for health care evolve, people may take charge of their own health. With this prospectus, public libraries should consider creating a consumer health collection to assist the public in their health care needs. Using neighborhood demographic information can inform the collection development librarians as to the dominant age groups, sex, and races within the neighborhood. With this information, appropriate consumer health materials may be assembled in the public library. METHODS: In order to visualize the demographics of a neighborhood, the computer program ArcView GIS (geographic information systems) was used to create maps for specified areas. The neighborhood data was taken from the U.S. Census Department's annual census and library addresses were accumulated through a free database. After downloading the census block information from http://www.census.gov/geo/www/tiger/ the data was manipulated with ArcView GIS and queried to produce maps displaying the requested neighborhood demographics to view in respect to libraries. RESULTS: ArcView GIS produced maps displaying public libraries and requested demographics. After viewing the maps the collection development librarian can see exactly what populations are served by the library and adjust the library's collection accordingly. CONCLUSIONS: ArcView GIS can be used to produce maps displaying the communities that libraries serve, spot boundaries, be it \"man-made or natural,\" that exist prohibiting customer service, and assist collection development librarians in justifying their purchases for a dedicated consumer health collection or resources in general.</p>","PeriodicalId":87058,"journal":{"name":"Biomedical digital libraries","volume":"1 1","pages":"3"},"PeriodicalIF":0.0000,"publicationDate":"2004-11-18","publicationTypes":"Journal Article","fieldsOfStudy":null,"isOpenAccess":false,"openAccessPdf":"https://sci-hub-pdf.com/10.1186/1742-5581-1-3","citationCount":"7","resultStr":"{\"title\":\"Using GIS to establish a public library consumer health collection.\",\"authors\":\"Elizabeth M Larue\",\"doi\":\"10.1186/1742-5581-1-3\",\"DOIUrl\":null,\"url\":null,\"abstract\":\"<p><p>BACKGROUND: Learning the exact demographic characteristics of a neighborhood in which a public library serves, assists the collection development librarian in building an appropriate collection. Gathering that demographic information can be a lengthy process, and then formatting the information for the neighborhood in question becomes arduous.As society ages and the methods for health care evolve, people may take charge of their own health. With this prospectus, public libraries should consider creating a consumer health collection to assist the public in their health care needs. Using neighborhood demographic information can inform the collection development librarians as to the dominant age groups, sex, and races within the neighborhood. With this information, appropriate consumer health materials may be assembled in the public library. METHODS: In order to visualize the demographics of a neighborhood, the computer program ArcView GIS (geographic information systems) was used to create maps for specified areas. The neighborhood data was taken from the U.S. Census Department's annual census and library addresses were accumulated through a free database. After downloading the census block information from http://www.census.gov/geo/www/tiger/ the data was manipulated with ArcView GIS and queried to produce maps displaying the requested neighborhood demographics to view in respect to libraries. RESULTS: ArcView GIS produced maps displaying public libraries and requested demographics. After viewing the maps the collection development librarian can see exactly what populations are served by the library and adjust the library's collection accordingly. CONCLUSIONS: ArcView GIS can be used to produce maps displaying the communities that libraries serve, spot boundaries, be it \\\"man-made or natural,\\\" that exist prohibiting customer service, and assist collection development librarians in justifying their purchases for a dedicated consumer health collection or resources in general.</p>\",\"PeriodicalId\":87058,\"journal\":{\"name\":\"Biomedical digital libraries\",\"volume\":\"1 1\",\"pages\":\"3\"},\"PeriodicalIF\":0.0000,\"publicationDate\":\"2004-11-18\",\"publicationTypes\":\"Journal Article\",\"fieldsOfStudy\":null,\"isOpenAccess\":false,\"openAccessPdf\":\"https://sci-hub-pdf.com/10.1186/1742-5581-1-3\",\"citationCount\":\"7\",\"resultStr\":null,\"platform\":\"Semanticscholar\",\"paperid\":null,\"PeriodicalName\":\"Biomedical digital libraries\",\"FirstCategoryId\":\"1085\",\"ListUrlMain\":\"https://doi.org/10.1186/1742-5581-1-3\",\"RegionNum\":0,\"RegionCategory\":null,\"ArticlePicture\":[],\"TitleCN\":null,\"AbstractTextCN\":null,\"PMCID\":null,\"EPubDate\":\"\",\"PubModel\":\"\",\"JCR\":\"\",\"JCRName\":\"\",\"Score\":null,\"Total\":0}","platform":"Semanticscholar","paperid":null,"PeriodicalName":"Biomedical digital libraries","FirstCategoryId":"1085","ListUrlMain":"https://doi.org/10.1186/1742-5581-1-3","RegionNum":0,"RegionCategory":null,"ArticlePicture":[],"TitleCN":null,"AbstractTextCN":null,"PMCID":null,"EPubDate":"","PubModel":"","JCR":"","JCRName":"","Score":null,"Total":0}
Using GIS to establish a public library consumer health collection.
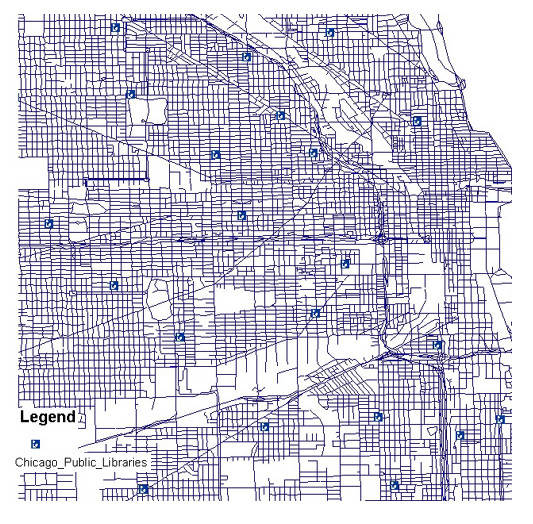
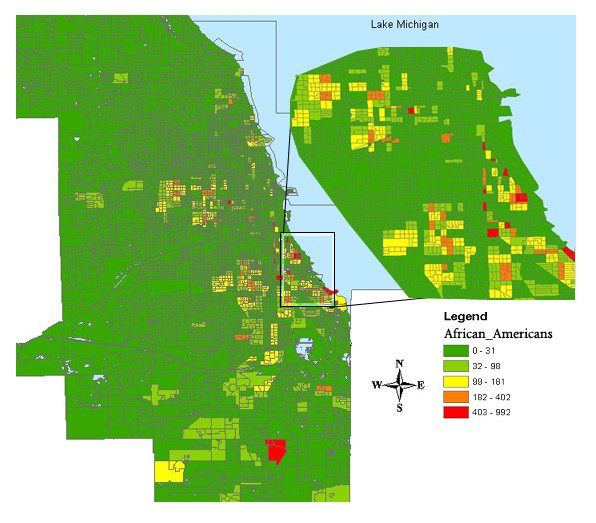
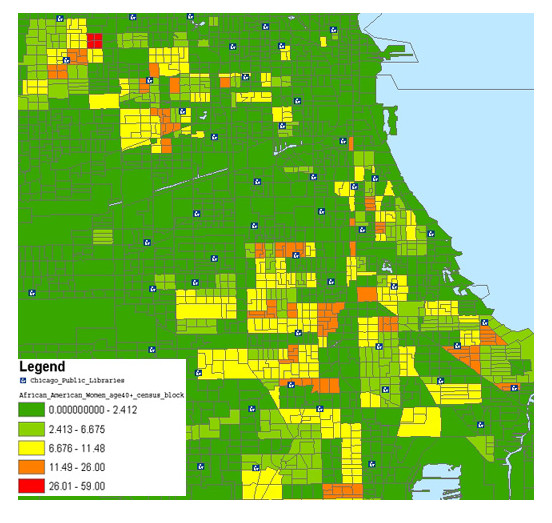
BACKGROUND: Learning the exact demographic characteristics of a neighborhood in which a public library serves, assists the collection development librarian in building an appropriate collection. Gathering that demographic information can be a lengthy process, and then formatting the information for the neighborhood in question becomes arduous.As society ages and the methods for health care evolve, people may take charge of their own health. With this prospectus, public libraries should consider creating a consumer health collection to assist the public in their health care needs. Using neighborhood demographic information can inform the collection development librarians as to the dominant age groups, sex, and races within the neighborhood. With this information, appropriate consumer health materials may be assembled in the public library. METHODS: In order to visualize the demographics of a neighborhood, the computer program ArcView GIS (geographic information systems) was used to create maps for specified areas. The neighborhood data was taken from the U.S. Census Department's annual census and library addresses were accumulated through a free database. After downloading the census block information from http://www.census.gov/geo/www/tiger/ the data was manipulated with ArcView GIS and queried to produce maps displaying the requested neighborhood demographics to view in respect to libraries. RESULTS: ArcView GIS produced maps displaying public libraries and requested demographics. After viewing the maps the collection development librarian can see exactly what populations are served by the library and adjust the library's collection accordingly. CONCLUSIONS: ArcView GIS can be used to produce maps displaying the communities that libraries serve, spot boundaries, be it "man-made or natural," that exist prohibiting customer service, and assist collection development librarians in justifying their purchases for a dedicated consumer health collection or resources in general.

 求助内容:
求助内容: 应助结果提醒方式:


