Jason T Bartlett, James C Hogg, Jean Bourbeau, Wan C Tan, Miranda Kirby
{"title":"CT气管表面粗糙度与慢性阻塞性肺疾病症状相关。","authors":"Jason T Bartlett, James C Hogg, Jean Bourbeau, Wan C Tan, Miranda Kirby","doi":"10.1093/radadv/umae002","DOIUrl":null,"url":null,"abstract":"<p><strong>Background: </strong>Trachea structural abnormalities occur in patients with chronic obstructive pulmonary disease (COPD), yet there are few methods for quantifying trachea surface topology.</p><p><strong>Purpose: </strong>To develop a method to quantify trachea surface roughness on CT imaging and investigate the association with airflow limitation and symptoms in COPD.</p><p><strong>Materials and methods: </strong>Participants from the multicenter prospective Canadian Cohort Obstructive Lung Disease study between 2009 and 2015 underwent CT imaging and analysis. Established CT measurements included: tracheal index (TI), defined as the smallest ratio of coronal-to-sagittal trachea diameter, low attenuation areas below -950 HU, and wall thickness of a theoretical 10-mm airway. Trachea surface roughness shape (SR<sub>S</sub>) was calculated as the percent fraction of the measurement box filled by the surface mesh. Multivariable regression models were used to determine association for CT measurements with forced expiratory volume in 1 second (FEV<sub>1</sub>) and forced vital capacity (FVC), and Medical Research Council dyspnea scale (MRC)≥3, adjusting for covariates.</p><p><strong>Results: </strong>A total of 1253 participants (mean age, 66 ± 10 years; 727 men) from 9 centers were investigated: <i>n</i> = 267 never smokers, <i>n</i> = 369 ever smokers, <i>n</i> = 352 mild COPD, and <i>n</i> = 265 moderate-to-severe COPD. There were no differences between groups for age or race (<i>P</i> < .05). In models including SR<sub>S</sub> and TI, a 1-standard deviation (SD) increase in SR<sub>S</sub> was independently associated with a 0.11-SD decrease in FEV<sub>1</sub> (β = -0.11; <i>P</i> < .001) and a 0.16-SD decrease in FEV<sub>1</sub>/FVC (β = -0.16; <i>P</i> < .001); a 1-point increase in SR<sub>S</sub> was associated with a 13% increased likelihood of MRC ≥ 3 (odds ratio = 1.13; <i>P</i> = .003). In models including SR<sub>S</sub>, low attenuation areas below -950 HU and wall thickness of a theoretical 10-mm airway, a 1-SD increase in SR<sub>S</sub> was associated with a 0.21-SD decrease in FEV<sub>1</sub> (β = -0.21; <i>P</i> < .001) and a 0.13-SD decrease in FEV<sub>1</sub>/FVC (β = -0.13; <i>P</i> < .001); a 1-point increase in SR<sub>S</sub> was associated with a 12% increased likelihood of MRC ≥ 3 (odds ratio = 1.12; <i>P</i> = .006).</p><p><strong>Conclusion: </strong>Increased trachea surface shape roughness is independently associated with worse airflow and increased symptom burden in COPD.</p>","PeriodicalId":519940,"journal":{"name":"Radiology advances","volume":"1 1","pages":"umae002"},"PeriodicalIF":0.0000,"publicationDate":"2024-03-19","publicationTypes":"Journal Article","fieldsOfStudy":null,"isOpenAccess":false,"openAccessPdf":"https://www.ncbi.nlm.nih.gov/pmc/articles/PMC12429235/pdf/","citationCount":"0","resultStr":"{\"title\":\"CT trachea surface roughness is associated with chronic obstructive pulmonary disease symptoms.\",\"authors\":\"Jason T Bartlett, James C Hogg, Jean Bourbeau, Wan C Tan, Miranda Kirby\",\"doi\":\"10.1093/radadv/umae002\",\"DOIUrl\":null,\"url\":null,\"abstract\":\"<p><strong>Background: </strong>Trachea structural abnormalities occur in patients with chronic obstructive pulmonary disease (COPD), yet there are few methods for quantifying trachea surface topology.</p><p><strong>Purpose: </strong>To develop a method to quantify trachea surface roughness on CT imaging and investigate the association with airflow limitation and symptoms in COPD.</p><p><strong>Materials and methods: </strong>Participants from the multicenter prospective Canadian Cohort Obstructive Lung Disease study between 2009 and 2015 underwent CT imaging and analysis. Established CT measurements included: tracheal index (TI), defined as the smallest ratio of coronal-to-sagittal trachea diameter, low attenuation areas below -950 HU, and wall thickness of a theoretical 10-mm airway. Trachea surface roughness shape (SR<sub>S</sub>) was calculated as the percent fraction of the measurement box filled by the surface mesh. Multivariable regression models were used to determine association for CT measurements with forced expiratory volume in 1 second (FEV<sub>1</sub>) and forced vital capacity (FVC), and Medical Research Council dyspnea scale (MRC)≥3, adjusting for covariates.</p><p><strong>Results: </strong>A total of 1253 participants (mean age, 66 ± 10 years; 727 men) from 9 centers were investigated: <i>n</i> = 267 never smokers, <i>n</i> = 369 ever smokers, <i>n</i> = 352 mild COPD, and <i>n</i> = 265 moderate-to-severe COPD. There were no differences between groups for age or race (<i>P</i> < .05). In models including SR<sub>S</sub> and TI, a 1-standard deviation (SD) increase in SR<sub>S</sub> was independently associated with a 0.11-SD decrease in FEV<sub>1</sub> (β = -0.11; <i>P</i> < .001) and a 0.16-SD decrease in FEV<sub>1</sub>/FVC (β = -0.16; <i>P</i> < .001); a 1-point increase in SR<sub>S</sub> was associated with a 13% increased likelihood of MRC ≥ 3 (odds ratio = 1.13; <i>P</i> = .003). In models including SR<sub>S</sub>, low attenuation areas below -950 HU and wall thickness of a theoretical 10-mm airway, a 1-SD increase in SR<sub>S</sub> was associated with a 0.21-SD decrease in FEV<sub>1</sub> (β = -0.21; <i>P</i> < .001) and a 0.13-SD decrease in FEV<sub>1</sub>/FVC (β = -0.13; <i>P</i> < .001); a 1-point increase in SR<sub>S</sub> was associated with a 12% increased likelihood of MRC ≥ 3 (odds ratio = 1.12; <i>P</i> = .006).</p><p><strong>Conclusion: </strong>Increased trachea surface shape roughness is independently associated with worse airflow and increased symptom burden in COPD.</p>\",\"PeriodicalId\":519940,\"journal\":{\"name\":\"Radiology advances\",\"volume\":\"1 1\",\"pages\":\"umae002\"},\"PeriodicalIF\":0.0000,\"publicationDate\":\"2024-03-19\",\"publicationTypes\":\"Journal Article\",\"fieldsOfStudy\":null,\"isOpenAccess\":false,\"openAccessPdf\":\"https://www.ncbi.nlm.nih.gov/pmc/articles/PMC12429235/pdf/\",\"citationCount\":\"0\",\"resultStr\":null,\"platform\":\"Semanticscholar\",\"paperid\":null,\"PeriodicalName\":\"Radiology advances\",\"FirstCategoryId\":\"1085\",\"ListUrlMain\":\"https://doi.org/10.1093/radadv/umae002\",\"RegionNum\":0,\"RegionCategory\":null,\"ArticlePicture\":[],\"TitleCN\":null,\"AbstractTextCN\":null,\"PMCID\":null,\"EPubDate\":\"2024/5/1 0:00:00\",\"PubModel\":\"eCollection\",\"JCR\":\"\",\"JCRName\":\"\",\"Score\":null,\"Total\":0}","platform":"Semanticscholar","paperid":null,"PeriodicalName":"Radiology advances","FirstCategoryId":"1085","ListUrlMain":"https://doi.org/10.1093/radadv/umae002","RegionNum":0,"RegionCategory":null,"ArticlePicture":[],"TitleCN":null,"AbstractTextCN":null,"PMCID":null,"EPubDate":"2024/5/1 0:00:00","PubModel":"eCollection","JCR":"","JCRName":"","Score":null,"Total":0}
引用次数: 0
摘要
背景:气管结构异常常见于慢性阻塞性肺疾病(COPD)患者,但目前尚缺乏量化气管表面拓扑结构的方法。目的:建立一种定量气管表面粗糙度的CT成像方法,探讨其与COPD患者气流受限和症状的关系。材料和方法:来自2009年至2015年加拿大多中心前瞻性队列阻塞性肺疾病研究的参与者进行了CT成像和分析。已建立的CT测量包括:气管指数(TI),定义为气管冠状与矢状直径的最小比值,-950 HU以下的低衰减区域,以及理论10mm气道的壁厚。气管表面粗糙度形状(SRS)以表面网格填充测量盒的百分比百分比计算。采用多变量回归模型确定CT测量值与1秒用力呼气量(FEV1)和用力肺活量(FVC)以及医学研究委员会呼吸困难量表(MRC)≥3(校正协变量)的相关性。结果:共调查了来自9个中心的1253名参与者(平均年龄66±10岁;727名男性):n = 267名从不吸烟者,n = 369名曾经吸烟者,n = 352名轻度COPD, n = 265名中度至重度COPD。年龄或种族组之间没有差异(P = S和TI), SRS的1个标准差(SD)增加与FEV1的0.11-SD下降独立相关(β = -0.11; P = -0.16; P = S与MRC≥3的可能性增加13%相关(优势比= 1.13;P = 0.003)。在包括SRS,低于-950 HU的低衰减区域和理论10毫米气道壁厚的模型中,SRS的1- sd增加与FEV1的0.21-SD降低相关(β = -0.21; P 1/FVC (β = -0.13; P S与MRC≥3的可能性增加12%相关(优势比= 1.12;P = 0.006)。结论:慢性阻塞性肺病患者气管表面粗糙度增加与气流恶化和症状负担增加独立相关。
CT trachea surface roughness is associated with chronic obstructive pulmonary disease symptoms.
Background: Trachea structural abnormalities occur in patients with chronic obstructive pulmonary disease (COPD), yet there are few methods for quantifying trachea surface topology.
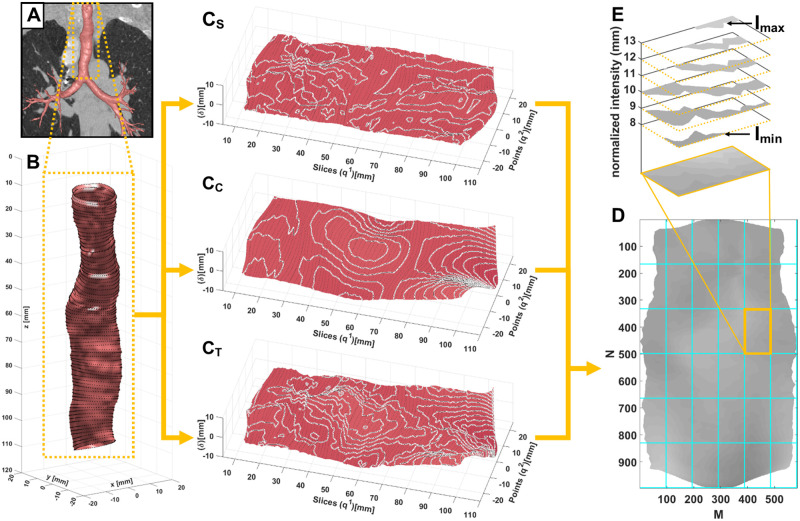
Purpose: To develop a method to quantify trachea surface roughness on CT imaging and investigate the association with airflow limitation and symptoms in COPD.
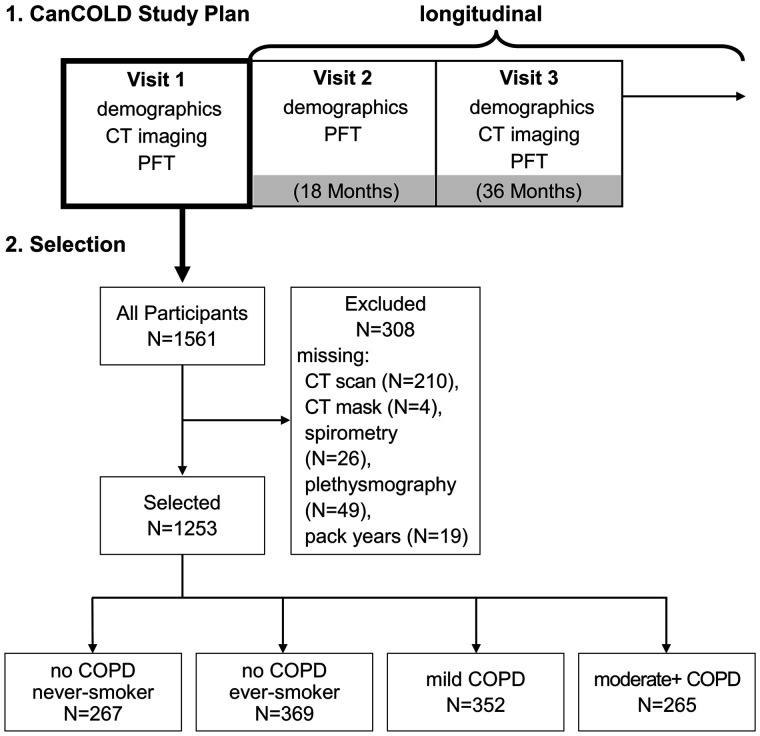
Materials and methods: Participants from the multicenter prospective Canadian Cohort Obstructive Lung Disease study between 2009 and 2015 underwent CT imaging and analysis. Established CT measurements included: tracheal index (TI), defined as the smallest ratio of coronal-to-sagittal trachea diameter, low attenuation areas below -950 HU, and wall thickness of a theoretical 10-mm airway. Trachea surface roughness shape (SRS) was calculated as the percent fraction of the measurement box filled by the surface mesh. Multivariable regression models were used to determine association for CT measurements with forced expiratory volume in 1 second (FEV1) and forced vital capacity (FVC), and Medical Research Council dyspnea scale (MRC)≥3, adjusting for covariates.
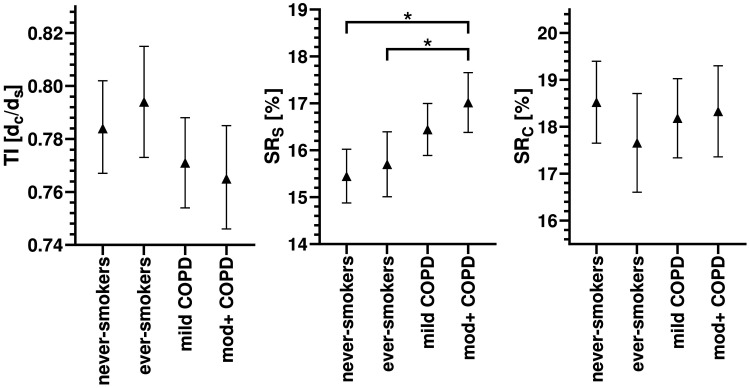
Results: A total of 1253 participants (mean age, 66 ± 10 years; 727 men) from 9 centers were investigated: n = 267 never smokers, n = 369 ever smokers, n = 352 mild COPD, and n = 265 moderate-to-severe COPD. There were no differences between groups for age or race (P < .05). In models including SRS and TI, a 1-standard deviation (SD) increase in SRS was independently associated with a 0.11-SD decrease in FEV1 (β = -0.11; P < .001) and a 0.16-SD decrease in FEV1/FVC (β = -0.16; P < .001); a 1-point increase in SRS was associated with a 13% increased likelihood of MRC ≥ 3 (odds ratio = 1.13; P = .003). In models including SRS, low attenuation areas below -950 HU and wall thickness of a theoretical 10-mm airway, a 1-SD increase in SRS was associated with a 0.21-SD decrease in FEV1 (β = -0.21; P < .001) and a 0.13-SD decrease in FEV1/FVC (β = -0.13; P < .001); a 1-point increase in SRS was associated with a 12% increased likelihood of MRC ≥ 3 (odds ratio = 1.12; P = .006).
Conclusion: Increased trachea surface shape roughness is independently associated with worse airflow and increased symptom burden in COPD.

 求助内容:
求助内容: 应助结果提醒方式:


