Hailemichael B Dadi, Desalegn T Negash, Sisay W Adall
{"title":"整合监测和气候数据用于埃塞俄比亚霍乱早期预警。","authors":"Hailemichael B Dadi, Desalegn T Negash, Sisay W Adall","doi":"10.5334/aogh.4742","DOIUrl":null,"url":null,"abstract":"<p><p><i>Background:</i> Ethiopia faces persistent cholera outbreaks worsened by increasing droughts and heavy rainfall due to climate change. More than 15.9 million Ethiopians reside in districts historically prone to severe cholera outbreaks. There have been efforts to enhance cholera surveillance by integrating it with climate data and prioritizing forecasting to improve adaptation. <i>Objectives:</i> This study aimed to investigate climate adaptation measures, explore temporal associations between climate variables and cholera incidence across Ethiopian districts, and identify observed thresholds and potential climate indicators for enhancing early warning systems. <i>Methods:</i> We conducted a literature review and secondary analysis of climate-cholera data. Temporal patterns and lagged effects of temperature and rainfall on cholera were examined using descriptive statistics, Pearson correlation, and time-lag analysis (up to three weeks). To determine optimal outbreak conditions, we assessed historical temperature and rainfall averages to measure anomalies. Data visualization, including line graphs, time series plots, and heatmaps, was performed using MS Excel and R. <i>Findings:</i> District-specific temperature and rainfall variations and thresholds were identified. The analysis dataset included 2,298 cholera cases across 13 districts. Cholera transmission exhibited distinct patterns: a monomodal pattern in five districts with primary peaks during the wet season (June-September), driven by heavy rainfall, and a bimodal pattern in eight districts with secondary peaks during the secondary wet season (February-May). Most outbreaks occurred between epidemiological weeks 10 and 42, with 63.7% of cases in weeks 29-42. Rainfall strongly correlated with cholera in monomodal districts, while temperature showed broader correlations in bimodal districts. <i>Conclusions:</i> Understanding district-specific variations in temperature and rainfall is crucial for managing cholera outbreak risks. These insights can inform early warning systems by providing essential indicators for potential outbreaks. Strengthening epidemiological forecasting capabilities, particularly in drought- and flood-prone regions, can support the cholera early warning system, enabling more timely and proactive interventions.</p>","PeriodicalId":48857,"journal":{"name":"Annals of Global Health","volume":"91 1","pages":"62"},"PeriodicalIF":3.2000,"publicationDate":"2025-09-13","publicationTypes":"Journal Article","fieldsOfStudy":null,"isOpenAccess":false,"openAccessPdf":"https://www.ncbi.nlm.nih.gov/pmc/articles/PMC12447798/pdf/","citationCount":"0","resultStr":"{\"title\":\"Integrating Surveillance and Climate Data for Cholera Early Warning in Ethiopia.\",\"authors\":\"Hailemichael B Dadi, Desalegn T Negash, Sisay W Adall\",\"doi\":\"10.5334/aogh.4742\",\"DOIUrl\":null,\"url\":null,\"abstract\":\"<p><p><i>Background:</i> Ethiopia faces persistent cholera outbreaks worsened by increasing droughts and heavy rainfall due to climate change. More than 15.9 million Ethiopians reside in districts historically prone to severe cholera outbreaks. There have been efforts to enhance cholera surveillance by integrating it with climate data and prioritizing forecasting to improve adaptation. <i>Objectives:</i> This study aimed to investigate climate adaptation measures, explore temporal associations between climate variables and cholera incidence across Ethiopian districts, and identify observed thresholds and potential climate indicators for enhancing early warning systems. <i>Methods:</i> We conducted a literature review and secondary analysis of climate-cholera data. Temporal patterns and lagged effects of temperature and rainfall on cholera were examined using descriptive statistics, Pearson correlation, and time-lag analysis (up to three weeks). To determine optimal outbreak conditions, we assessed historical temperature and rainfall averages to measure anomalies. Data visualization, including line graphs, time series plots, and heatmaps, was performed using MS Excel and R. <i>Findings:</i> District-specific temperature and rainfall variations and thresholds were identified. The analysis dataset included 2,298 cholera cases across 13 districts. Cholera transmission exhibited distinct patterns: a monomodal pattern in five districts with primary peaks during the wet season (June-September), driven by heavy rainfall, and a bimodal pattern in eight districts with secondary peaks during the secondary wet season (February-May). Most outbreaks occurred between epidemiological weeks 10 and 42, with 63.7% of cases in weeks 29-42. Rainfall strongly correlated with cholera in monomodal districts, while temperature showed broader correlations in bimodal districts. <i>Conclusions:</i> Understanding district-specific variations in temperature and rainfall is crucial for managing cholera outbreak risks. These insights can inform early warning systems by providing essential indicators for potential outbreaks. Strengthening epidemiological forecasting capabilities, particularly in drought- and flood-prone regions, can support the cholera early warning system, enabling more timely and proactive interventions.</p>\",\"PeriodicalId\":48857,\"journal\":{\"name\":\"Annals of Global Health\",\"volume\":\"91 1\",\"pages\":\"62\"},\"PeriodicalIF\":3.2000,\"publicationDate\":\"2025-09-13\",\"publicationTypes\":\"Journal Article\",\"fieldsOfStudy\":null,\"isOpenAccess\":false,\"openAccessPdf\":\"https://www.ncbi.nlm.nih.gov/pmc/articles/PMC12447798/pdf/\",\"citationCount\":\"0\",\"resultStr\":null,\"platform\":\"Semanticscholar\",\"paperid\":null,\"PeriodicalName\":\"Annals of Global Health\",\"FirstCategoryId\":\"3\",\"ListUrlMain\":\"https://doi.org/10.5334/aogh.4742\",\"RegionNum\":4,\"RegionCategory\":\"医学\",\"ArticlePicture\":[],\"TitleCN\":null,\"AbstractTextCN\":null,\"PMCID\":null,\"EPubDate\":\"2025/1/1 0:00:00\",\"PubModel\":\"eCollection\",\"JCR\":\"Q2\",\"JCRName\":\"PUBLIC, ENVIRONMENTAL & OCCUPATIONAL HEALTH\",\"Score\":null,\"Total\":0}","platform":"Semanticscholar","paperid":null,"PeriodicalName":"Annals of Global Health","FirstCategoryId":"3","ListUrlMain":"https://doi.org/10.5334/aogh.4742","RegionNum":4,"RegionCategory":"医学","ArticlePicture":[],"TitleCN":null,"AbstractTextCN":null,"PMCID":null,"EPubDate":"2025/1/1 0:00:00","PubModel":"eCollection","JCR":"Q2","JCRName":"PUBLIC, ENVIRONMENTAL & OCCUPATIONAL HEALTH","Score":null,"Total":0}
Integrating Surveillance and Climate Data for Cholera Early Warning in Ethiopia.
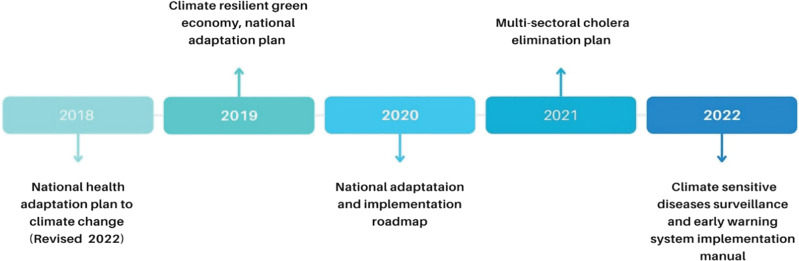
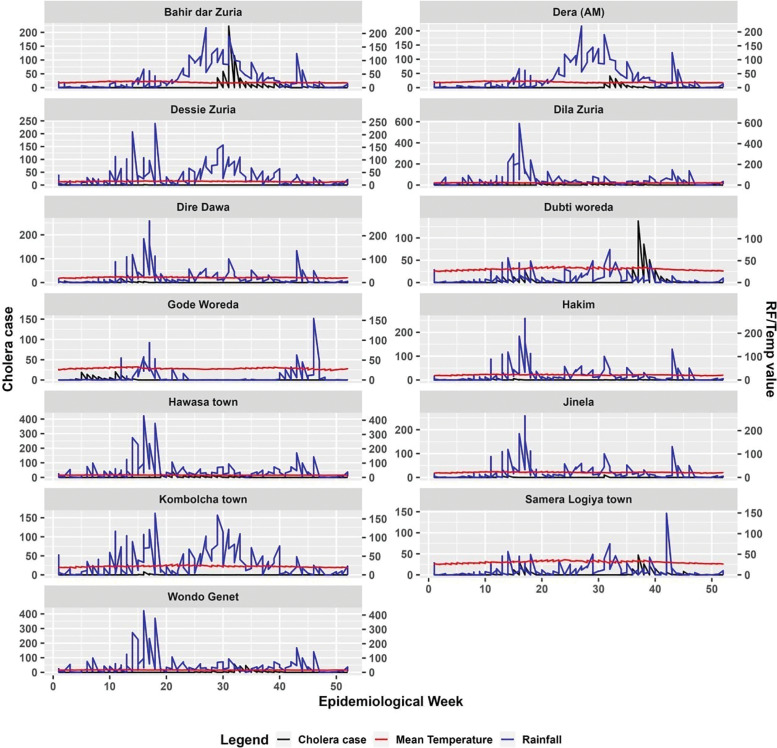
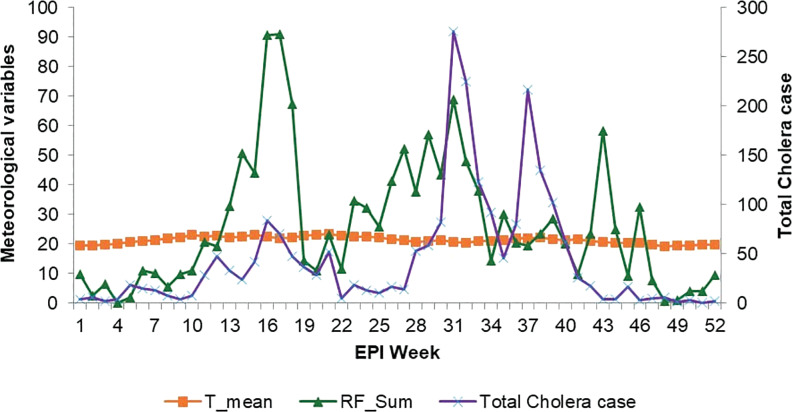
Background: Ethiopia faces persistent cholera outbreaks worsened by increasing droughts and heavy rainfall due to climate change. More than 15.9 million Ethiopians reside in districts historically prone to severe cholera outbreaks. There have been efforts to enhance cholera surveillance by integrating it with climate data and prioritizing forecasting to improve adaptation. Objectives: This study aimed to investigate climate adaptation measures, explore temporal associations between climate variables and cholera incidence across Ethiopian districts, and identify observed thresholds and potential climate indicators for enhancing early warning systems. Methods: We conducted a literature review and secondary analysis of climate-cholera data. Temporal patterns and lagged effects of temperature and rainfall on cholera were examined using descriptive statistics, Pearson correlation, and time-lag analysis (up to three weeks). To determine optimal outbreak conditions, we assessed historical temperature and rainfall averages to measure anomalies. Data visualization, including line graphs, time series plots, and heatmaps, was performed using MS Excel and R. Findings: District-specific temperature and rainfall variations and thresholds were identified. The analysis dataset included 2,298 cholera cases across 13 districts. Cholera transmission exhibited distinct patterns: a monomodal pattern in five districts with primary peaks during the wet season (June-September), driven by heavy rainfall, and a bimodal pattern in eight districts with secondary peaks during the secondary wet season (February-May). Most outbreaks occurred between epidemiological weeks 10 and 42, with 63.7% of cases in weeks 29-42. Rainfall strongly correlated with cholera in monomodal districts, while temperature showed broader correlations in bimodal districts. Conclusions: Understanding district-specific variations in temperature and rainfall is crucial for managing cholera outbreak risks. These insights can inform early warning systems by providing essential indicators for potential outbreaks. Strengthening epidemiological forecasting capabilities, particularly in drought- and flood-prone regions, can support the cholera early warning system, enabling more timely and proactive interventions.
期刊介绍:
ANNALS OF GLOBAL HEALTH is a peer-reviewed, open access journal focused on global health. The journal’s mission is to advance and disseminate knowledge of global health. Its goals are improve the health and well-being of all people, advance health equity and promote wise stewardship of the earth’s environment.
The journal is published by the Boston College Global Public Health Program. It was founded in 1934 by the Icahn School of Medicine at Mount Sinai as the Mount Sinai Journal of Medicine. It is a partner journal of the Consortium of Universities for Global Health.
 求助内容:
求助内容: 应助结果提醒方式:


